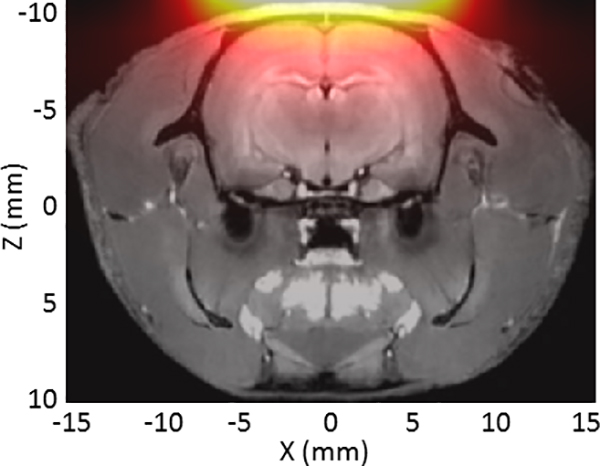
Figure 3:

Simulated sensitivity map under surface of the single-sided detector overlaid on a T1-weighted MRI image of a rat head. The sensitivity map was produced by simulating the acquired the 3rd harmonic signal for discrete SPIO samples at each location. The volume of the brain weighted by the sensitivity profile of the detector is about 24% percent of the full brain volume.
