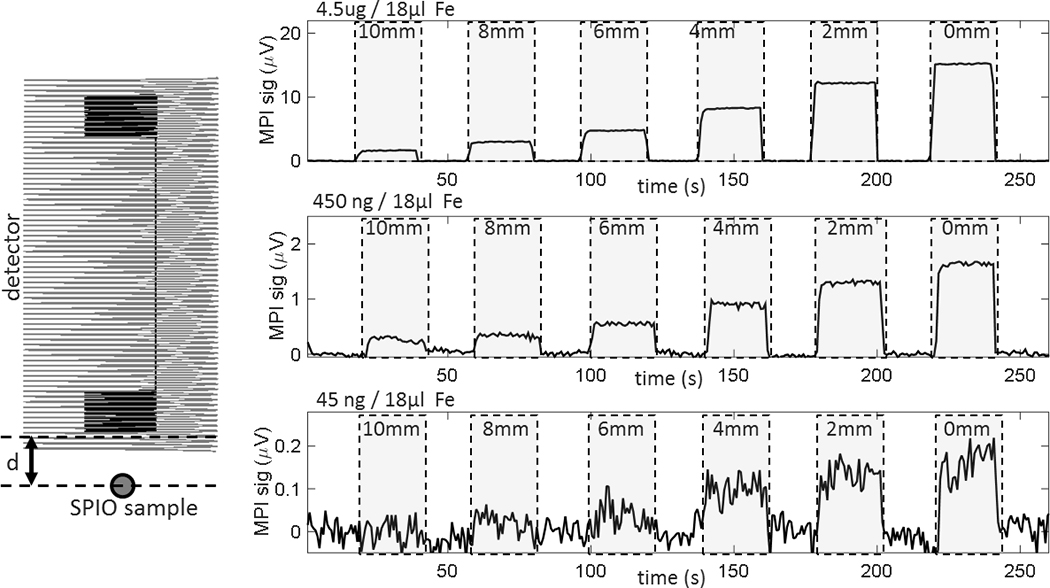
Figure 4:

Plots show detection capability of the MP detector in relation to the distance between the detector surface and SPIO sample (d). The 3rd harmonic signal change is shown when sample is moved to 10 mm, 8 mm, 6 mm, 4 mm, 2 mm, and 0 mm away from the end of the detector (in between, sample is removed from detectable area). The phantom holds 18 μL bulbs containing 4.5 μg, 450 ng, and 45 ng Fe in H20 solution. The lowest concentration sample (45 ng Fe) is lower than the expected Fe change from a 25% neuroactivation-induced CBV change in a 3mm voxel (52 ng). At the surface of the detector (d = 0 mm), this concentration was detected with an SNR of 5.4. Each point represents the 75 kHz signal component from a 16 ms integration time.
