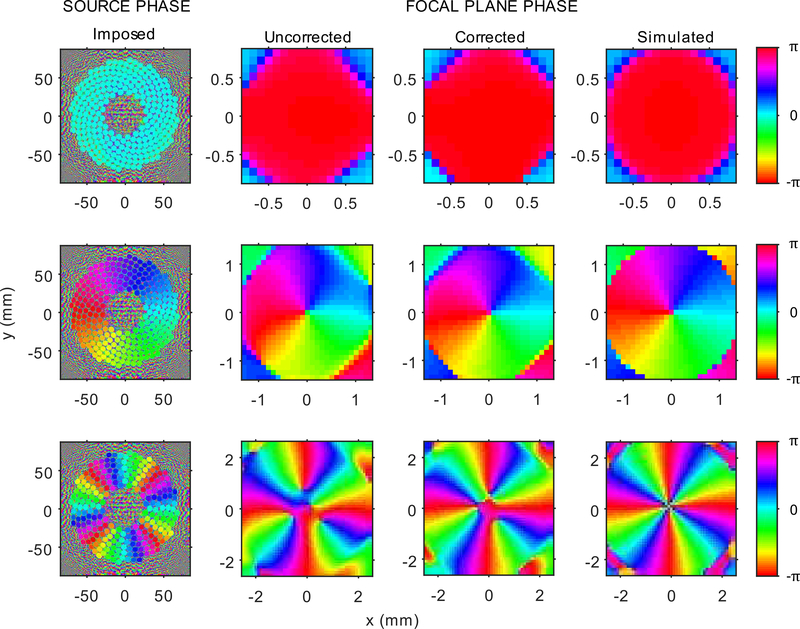
Fig. 10.
Phase distribution of vortex beams (radians). Left to right) imposed phase distribution on the array’s discrete elements, measured phase distribution at the focal plane before and after applying phase corrections, and simulation for (top to bottom) M = 0, 1, and 4. Before applying phase corrections, there are slight variations in the phase distribution along the radial direction. The smooth phase transition indicates that the array behaves as a continuous acoustic source.

