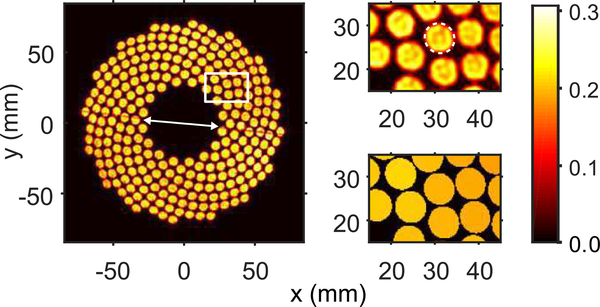
Fig. 5.
Left) Transducer’s surface normal velocity amplitude profile, |U| (m/s), obtained with compensation for the hydrophone directivity. The arrow marks the line along the hemispherical surface splitting the transducer surface in two halves due to the manufacturing process. Right) Close-up of the elements in the upper right corner of the array; top) showing the surface normal velocity amplitude profile, |U| (m/s), with an example of the calculated boundaries of the elements shown as a dashed contour on a single element, and bottom) showing the averaged and localized surface normal velocity amplitude, |U| (m/s), per element after post-processing of the holography results. Note that the reconstructed surface normal velocity (top) is not uniform within each element which may be explained not only by some true heterogeneity of the source vibration, but by the omission of evanescent wave components in the far-field holography reconstruction used.

