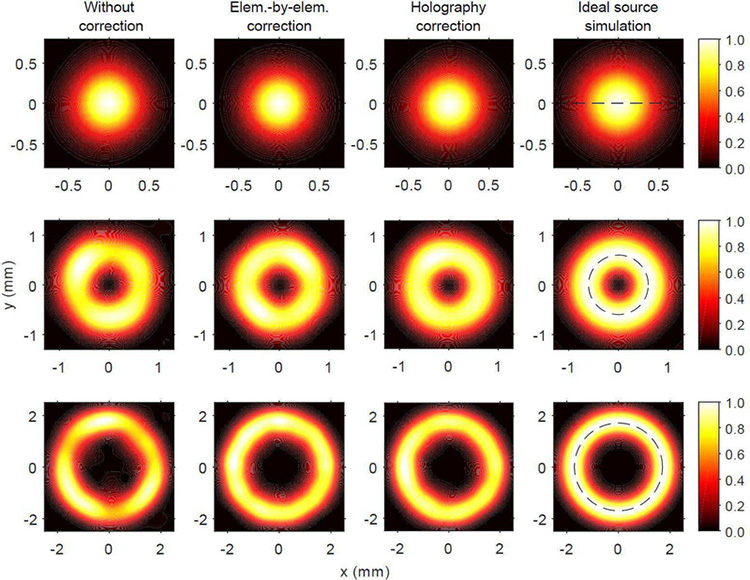
Fig. 8.
Normalized 2D intensity distribution to its maximum value in the focal plane for different M values: top row) M = 0, middle) M = 1, and bottom) M = 4, for (from left to right) measurements before and after apodization using element-by-element measurements and holography results, and simulation. The corrections improve the uniformity of the focal rings and final experimental results look more like the simulation. The dashed line in the left column shows the line along which the sectional and circumferential cuts were taken for use in Fig. 9.

