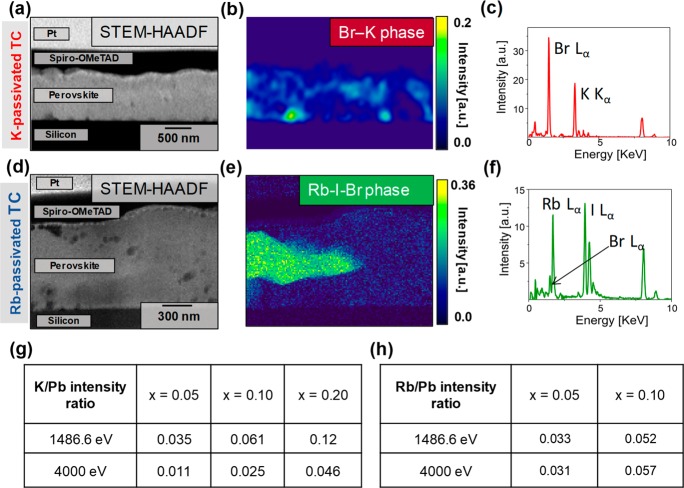
Figure 2.
(a) HAADF STEM cross-sectional image of a TC perovskite thin film passivated with K (x = 0.10). (b) NMF decomposition of the K-passivated TC sample showing the KBr phase and (c) the corresponding EDX spectra (see Figure S5 for the perovskite phase). (d) HAADF STEM cross-sectional image of a TC perovskite thin film passivated with Rb (x = 0.10). (e) NMF decomposition of the Rb-passivated TC sample showing the Rb–I–Br phase and (f) the corresponding EDX spectra (see Figures S5 and S6 for the perovskite phase). Intensity ratios between different core levels of the (g) K and (h) Rb additives with respect to the lead with different probe beam energies from XPS (1486.6 eV) and HAXPES (4000 eV) measurements. We used Pb 4f, K 2p, Cs 4d, and Rb 3d core levels for all beam energies (see Figures S7 and S8 for full spectra).

