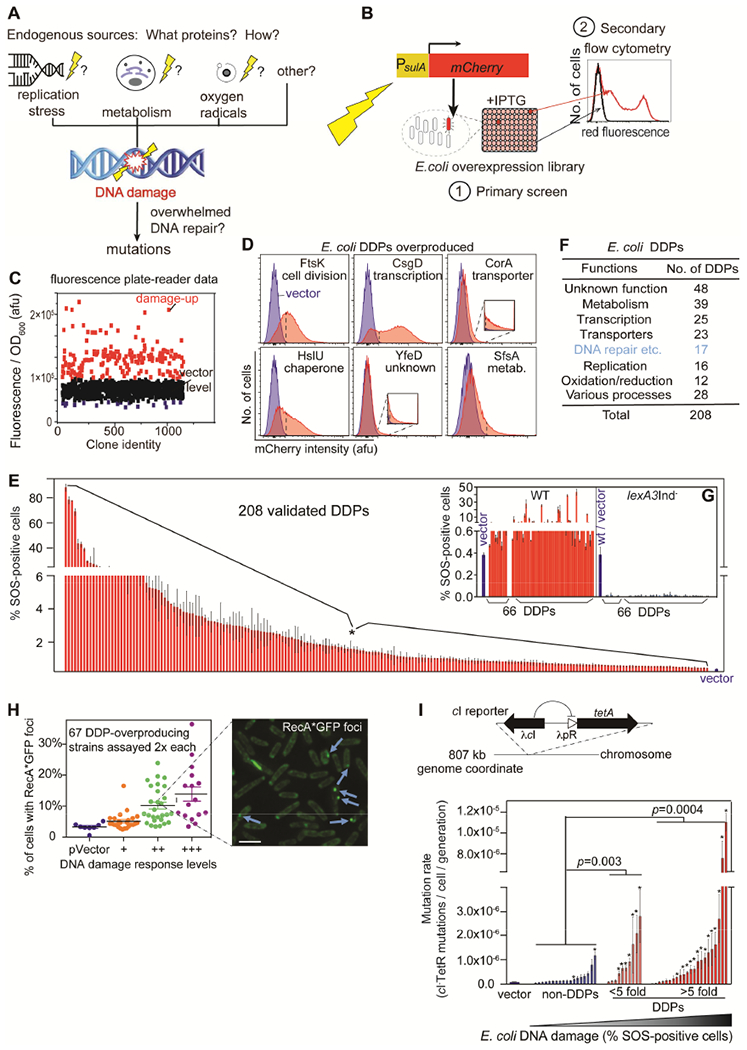
Figure 1. Comprehensive Discovery of E. coli DNA “Damage-up” Protein Network.

(A) Endogenous DNA damage may promote mutations and occurs by unknown means.
(B) Screen for overproduction DNA damage-up proteins (DDPs). (1) Fluorescence plate-reader screen of E. coli Mobile overexpression library for fluorescence from SOS-DNA-damage-response reporter (Nehring et al., 2016). (2) Elimination of false-positives by flow-cytometry–single-cell assay.
(C) Plate-reader representative results: afu, arbitrary fluorescence units, per OD600, (biomass). Red, potential DDPs with fold change >30%.
(D) Representative flow-cytometry validation of SOS-positive DDPs. Dashed line, “gate” for SOS-positives (significance, STAR Methods). Blue, vector control; red, DDP producers.
(E) % SOS-positive cells for the 208 validated E. coli DDPs (Table S1).
(F) DDP network summary; proteins of many different functions are DDPs.
(G) LexA-dependence of fluorescence from DDPs shows SOS-response activation/DNA damage.
(H) SOS-positive phenotype correlated with RecA*GFP foci, indicating persistent single-stranded DNA. 67 representative DDPs show 32 (48%) with elevated RecA*GFP foci (p < 0.05, unpaired two-tail t-test), r = 0.7, p = 1.3×10⁻¹⁰, Pearson’s correlation, (data, Table S1). Scale bar: 2μm.
(I) Mutation-rate increase with DNA-damage levels in representative DDP-producing clones. Above, assay (STAR Methods). Each bar, the mean mutation rate (± SEM) of each strain, N=3 (STAR Methods; Table S1). P-values, fraction of clones with mutation rate significantly higher than vector-only control, one-way Fisher’s exact test.
