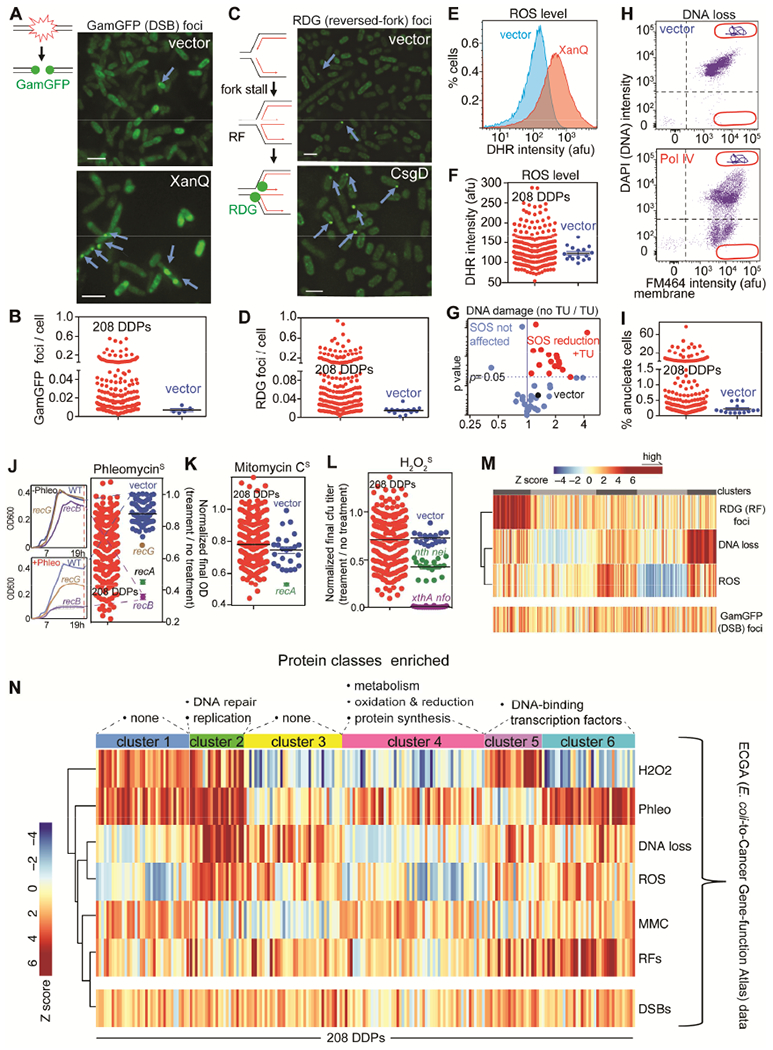
Figure 4. Kinds, Causes and Consequences of DNA Damage from E. coli DDPs.

Clone by clone data Table S1.
(A) DDPs that increase DNA double-strand breaks (DSBs), detected as GamGFP foci. Scale bar: 2μm. Lines, DNA strands; green balls, GamGFP.
(B) 87 of the 208 (45% of) E. coli DDPs promote DSBs.
(C) Stalled, reversed replication forks (RFs) detected as RDG foci in recA− cells, per (Xia et al., 2016). Scale bar: 2μm. Lines, DNA strands; red lines, new strands; green balls, RDG.
(D) 106 of the 208 (51% of) E. coli DDPs promote fork stalling and reversal.
(E-I) Flow-cytometric assays for—
(E) elevated ROS, DHR fluorescence, example.
(F) 56 (27% of) DDPs induce high ROS.
(G) DNA damage (% SOS-on cells) from 17 of 43 high-ROS DDPs tested is reduced by ROS-quenching agent thiourea (TU).
(H) DNA loss: “anucleate” cells with no DNA, example. Events below the horizontal line, anucleate.
(I) 67 of 208 (32% of) DDPs induce DNA loss.
(J-L) Sensitivity to DNA-damaging agents implies DNA-repair-pathway reduction (potential saturation), possibly from elevated DNA damage. Relevant DNA-repair-defective controls shown. Assays for slowed growth per J left (STAR Methods).
(J) 106 of 208 DDP clones (51%) show phleomycin (DSB) sensitivity.
(K) 10 of 208 DDP clones (5%) sensitive to DNA cross-linker mitomycin C (MMC) (reduced NER and/or HDR).
(L) H2O2 sensitivity (reduced BER) from 75 of 208 DDPs (36%).
(M) Stalled replication (RFs) clusters with particular DDPs; DNA breakage does not (STAR Methods).
(N) Clustering Z scores reveal DNA-damage signatures. H2O2, hydrogen-peroxide sensitivity; Phleo, phleomycin sensitivity; DNA loss (anucleate cells); ROS levels; MMC, (MMC sensitivity); RFs (reversed forks); DSBs. Vertical bars: phenotype scores of each DDP clone. The 6 clusters/DNA-damage signatures suggest at least 6 mechanisms of DNA-damage generation. Protein category enrichment (above, one-way Fisher’s exact test): clusters 2 p = 0.01; 4; p = 0.01, 5 and 6 p = 0.03.
