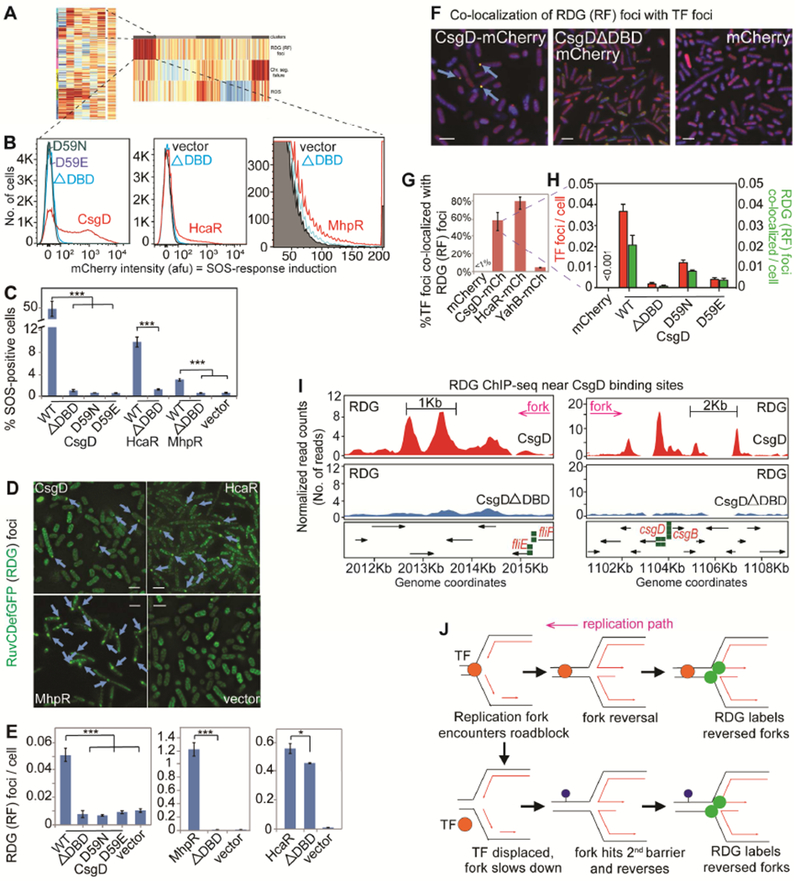
Figure 5. E. coli Transcription Factors Promote Replication-fork Stalling via DNA Binding.

(A) DNA-binding transcription factors (TFs) enriched in DDP clones with high reversed forks (RFs, p =0.002, one-way Fisher’s exact test).
(B) TF DNA-binding required for DNA-damage promotion. Representative data, TFs and corresponding mutants: ΔDBD, DNA-binding domain deletion; and single amino-acid changes that reduce DNA-binding.
(C) Mean ± SEM of ≥3 experiments.
(D) DNA-binding required for RDG (RF) foci (blue arrows). Representative images, scale bar: 2μm. Figure S6A, all genotypes.
(E) Mean ± SEM of ≥3 experiments.
(F) DNA-binding TF-mCherry foci co-localize with RDG RF foci. Representative data. Blue arrows, co-localized foci, scale bar: 2μm.
(G) Mean ± SEM of ≥3 experiments. Figure S6B, images.
(H) Co-localization of TF with RDG foci requires TF DNA-binding.
(I) RDG ChIP-Seq RF peaks (in ΔrecA) enriched near CsgD-binding sites (green squares; p =0.01, two-tailed z-test versus simulated data, Figure S7 legend). Figure S7A-C, complete set RF peaks.
(J) Model: overproduced TFs (orange circles) bound to DNA (parallel lines) induce replication roadblock RFs. Lower model, how RFs might appear downstream of a DNA-bound TF: first, the bound TF slows/impairs the fork; second, a downstream replication-slowing site/occurrence that otherwise would not have stalled replication.
