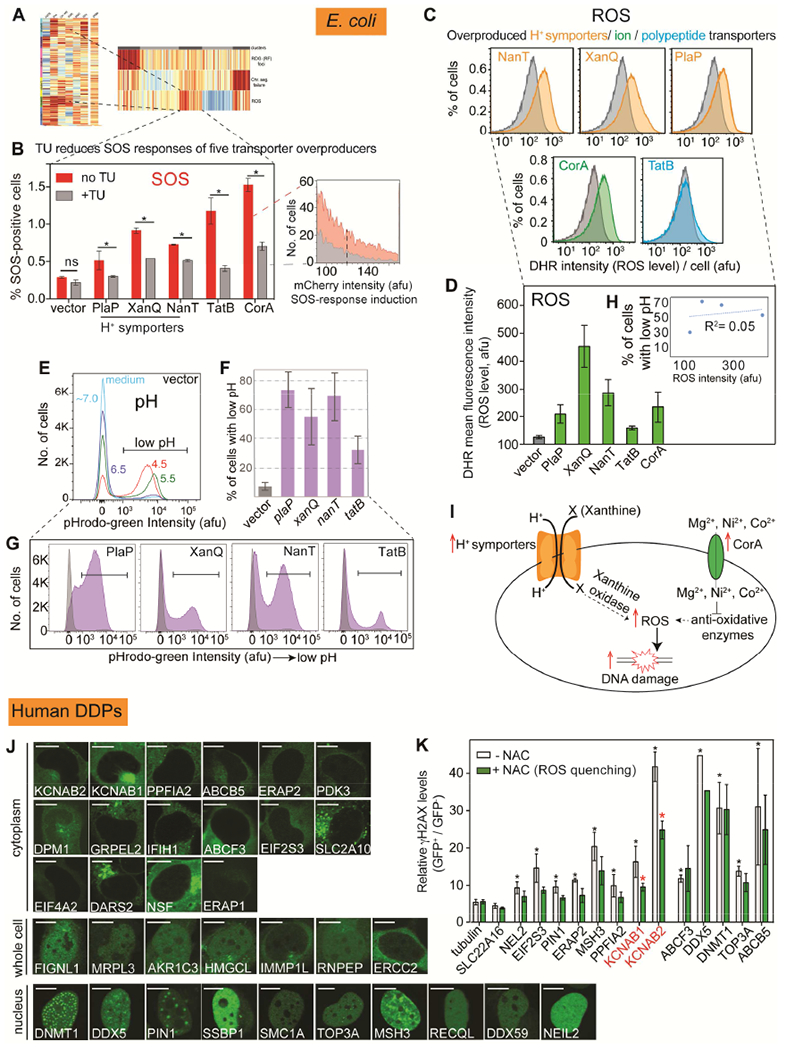
Figure 6. E. coli and Human Transporters Promote DNA Damage via ROS.

(A) E. coli high-ROS clusters enriched for membrane-spanning transporters (p = 0.004 one-way Fisher’s exact test).
(B) DNA damage from 5 E. coli transporters reduced by ROS-scavenger thiourea (TU): ROS-dependent. Mean ± range, N=2; representative data.
(C) Transporter overproduction elevates ROS levels. (Table S1). Gray, vector.
(D) Mean ± range, N=2.
(E) pHrodo-green pH stain and flow cytometry in buffers with varied pH show cell subpopulations with decreased pH.
(F) Overproducing E. coli H+ symporters increases activity/reduces pH: gain-of-function. Grey, vector only. Mean ± range of two experiments.
(G) Representative flow-cytometry data.
(H) Reduced pH is not correlated quantitatively with increased ROS (R2=0.05, Pearson’s correction), suggesting that the specific cargoes may promote DNA damage.
(I) Models. Discussed Figure S4D legend.
(J) Overproduced GFP-tagged hDDPs cellular localization. Bar: 5 μm.
(K) ROS underlie DNA damage caused by human KCNAB1/2 transporter overproduction. NAC: N-acetyl-cysteine. * p < 0.05 relative to untreated GFP-tubulin control; * p < 0.05 relative to the corresponding NAC-untreated control, unpaired two-tailed t-test.
