FIG. 4.
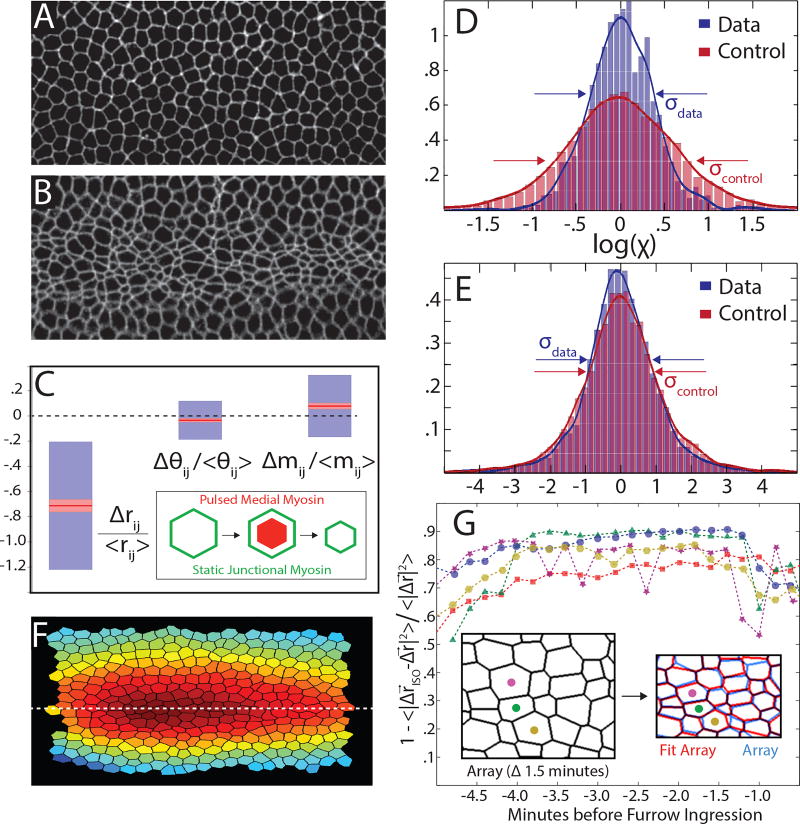
Experimental tests of ATN model predictions. (A–B) Ventral view of Drosophila embryo (imaged using Spider-GFP marking cell membranes) at the beginning of VF formation (A) and 4 minutes later (B). Note the variability of apical cell area in (B). (C) The measured changes in edge length Δrij, edge orientation angle Δθij and relative myosin level Δmij during VF formation: red lines denote the means (with pink haloes giving 95% confidence intervals on the mean given by the t-test) and blue boxes denote one standard deviation. Edge length shrinks by ~ 75% while relative changes in cortical myosin and edge orientation are considerably smaller. (D–E) Test of compatibility (Eq.5) compares the PDF of the measured log χ’s (blue) with the control distribution (red) defined by permuting angles. Embryonic mesoderm (D) exhibits a strong tendency towards compatibility (log χ ≈ 0) while epithelium of the third instar imaginal wing disc (E), does not. (F) Spatial profile of the isogonal mode amplitude, {Θα} describes increasing anisotropic compression of cells towards ventral midline. (G) Fraction of measured deformation (Δr) captured by isogonal deformation (Δriso) obtained via least squares minimization of Eq.6. Each color represents an independent measurement with 200 cells. Inset: a graphical comparison for a sample fit.

