. 2018 Dec 27;7:e41081. doi: 10.7554/eLife.41081

Figure 1. Comparison of transcriptional activity in schizonts (SZ) and hypnozoites (HZ) at day 6/7 and day 9.

Left panel: Distribution of average gene expression values in the schizont samples at day 6/7 (light blue; n = 3) and at day 9 (dark blue; n = 2), and distribution of average gene expression values in the hypnozoites samples at day 6/7 (light green; n = 4) and at day 9 (dark green; n = 2). FPKM, Fragments per kilobase of transcript per million mapped reads. Upper right panel: Venn diagrams show the overlap of genes expressed ≥1 FPKM and ≥10 FPKM, respectively, at day 6/7 and at day 9 in the schizont samples. Lower right panel: Venn diagrams show the overlap of genes expressed ≥1 FPKM and ≥10 FPKM, respectively, at day 6/7 and at day 9 in the hypnozoite samples.

Figure 1.

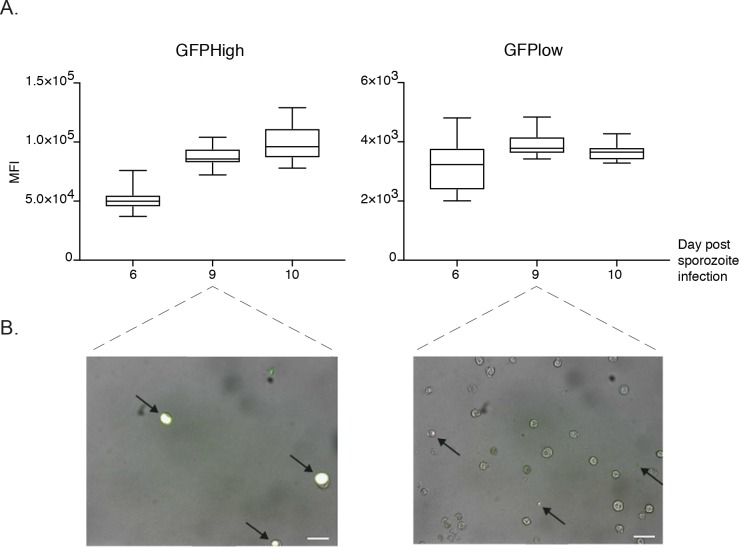
Figure 1—figure supplement 1. Quality check of FACS-sorted parasite cells.

Figure 1—figure supplement 1.

(A) Bar chart depicting the median fluorescence intensity (MFI) values of GFPhigh (schizonts) and GFPlow (hypnozoites) samples FACS-sorted at days 6, 9 and 10 post-sporozoite infection. MFI values are depicted as box whisker (min-max) plots. See Materials and methods for details. (B) FACS-purified GFPhigh and GFPlow fractions at day nine post sporozoite infection. GFPlow parasites were found both in- and outside hepatocytes after sorting (arrows). Day 9 GFPlow sorted parasite samples contained substantial amounts of uninfected hepatocytes. Scalebar 50 μm.
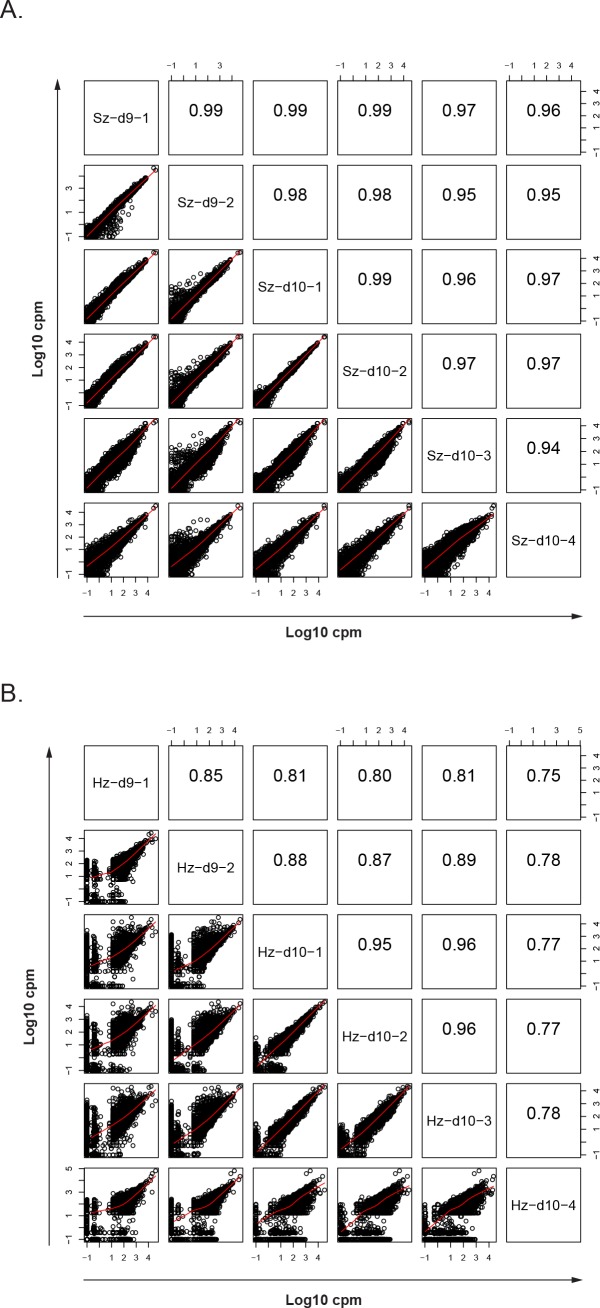
Figure 1—figure supplement 2. Correlation of gene expression values between biological replicates.

Figure 1—figure supplement 2.

Scatter plot showing all pairwise log10 normalized CPM correlations between samples from (A) schizonts and (B) hypnozoites. The upper right part of the panel shows the value of the calculated Pearson correlation coefficients.
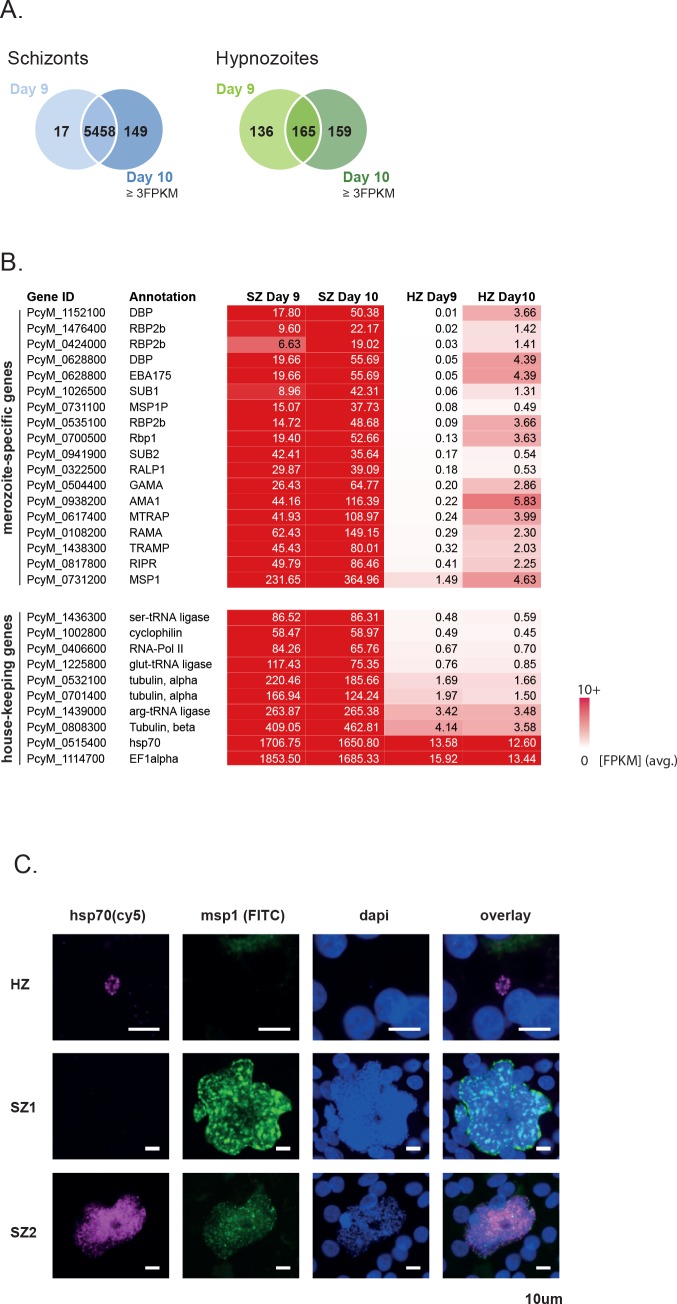
Figure 1—figure supplement 3. Possible contamination of day 10 hypnozoites with schizont derived transcripts.

Figure 1—figure supplement 3.

(A) Venn diagrams show the overlap of genes expressed ≥3 FPKM at day 6/7 and 9 in the schizont samples (left, SZ) and in the hypnozoite samples (right, HZ), respectively. (B) Upper Table: Known merozoite-specific markers along with their mean expression levels (FPKM) in the schizont and hypnozoite samples at day 9 and day 10. Lower Table: Selected control genes along with their mean expression levels (FPKM) in the schizont and hypnozoite samples at day 9 and day 10. (C) RNA-FISH (RNAscope) of a hypnozoite and two liver schizonts at 10 days post-sporozoite infection. Staining of a hypnozoite (HZ) and a schizont (SZ2) probed with hsp70 (cy5). Staining was absent in fully mature schizonts (SZ1). Probing against msp1 (FITC) detected transcripts in schizonts only. Scalebar 10 μm.
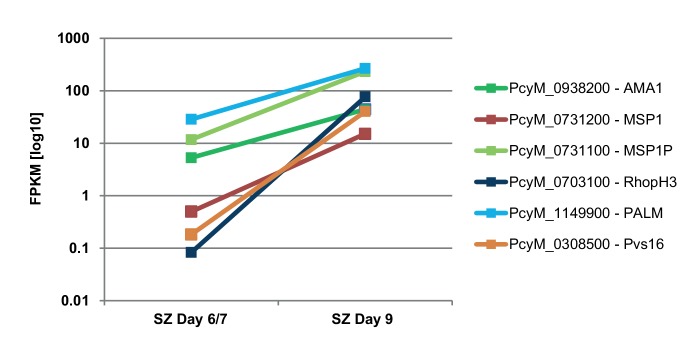
Figure 1—figure supplement 4. Diagram showing mean gene expression values (FPKM) of schizogony markers in the schizont samples at day 6/7 and day 9.

Figure 1—figure supplement 4.

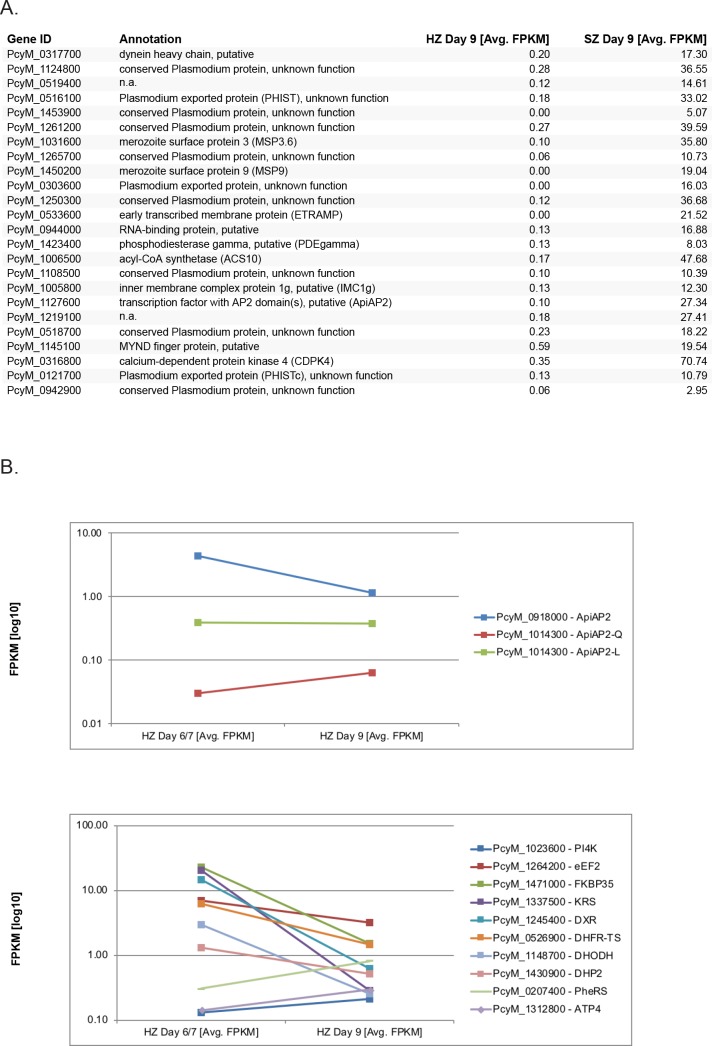
Figure 1—figure supplement 5. Expression levels of specific genes of interest.

Figure 1—figure supplement 5.

(A) Table showing hypnozoite-specific genes previously identified in Voorberg-van der Wel et al., 2017 passing the cut-off of >2 fold change absolute value and 10% false discovery rate at day 6/7, along with their mean gene expression values (FPKM) in hypnozoites and schizonts at day 9. (B) Upper diagram: Mean gene expression values (FPKM) of 3 ApiAP2 factors in the hypnozoite samples at day 6/7 and day 9. Lower diagram: Mean gene expression values (FPKM) of known malaria drug targets (Voorberg-van der Wel et al., 2017) in the hypnozoite samples at day 6/7 and day 9.