. 2019 Jan 23;8:e43888. doi: 10.7554/eLife.43888

Figure 2. Myelin outfoldings and reduced nerve conduction velocity in mice lacking oligodendroglial expression of ANLN.

(A–A’) Silver impregnation (in brown) visualizes myelinated fiber tracts in mice lacking ANLN from myelinating cells (Anlnfl/fl;CnpCre/WT-mice; Anln cKO) and in control mice (Anlnfl/fl) at P75. (A) displays coronal brain sections; A’) shows sagittal sections through the cerebellum. Images representative of three mice per genotype. For generation and validation of Anln cKO mice see Figure 2—figure supplement 1. (B) Electron micrographs of optic nerves exemplify myelin outfoldings at P75. Stippled lines highlight myelin outfoldings; associated axons are marked with asterisks. (C) Quantitative evaluation of electron micrographs of optic nerves reveals progressive emergence of myelin outfoldings in adult Anlnfl/fl;CnpCre/WT mice (Anln cKO). Mean +/SEM. n = 4–6 mice per genotype and age; two-tailed unpaired t-test P14 p=0.0076; P75 p=0.0009; 6mo p=0.0007. (D,D‘) g-ratio analysis of electron micrographs of optic nerves at six mo indicates normal myelin sheath thickness in Anln cKO mice. Mean +/SEM. Not significant according to two-way ANOVA (p=0.9279). (E) Quantitative evaluation of electron micrographs of optic nerves at six mo reveals a normal frequency of myelinated axons in Anln cKO mice. Mean +/SEM. n = 4–5 mice per genotype; not significant (n.s.) according to two-tailed unpaired t-test (p=0.1827). (F) Quantitative evaluation of electron micrographs of optic nerves at six mo indicates that there is no increased frequency of degenerating/degenerated axons in Anln cKO mice. Mean +/SEM. n = 4–5 mice per genotype; not significant (n.s.) according to two-tailed unpaired t-test (p=0.8664). For immunohistochemical assessment of neuropathology see Figure 2—figure supplement 2. (G) Electrophysiological measurement reveals reduced nerve conduction velocity in the spinal cord of Anln cKO compared to control (Anlnfl/fl) mice at six mo. Mean +/SEM. n = 7–11 mice per genotype; two-tailed unpaired t-test (p=0.0149). For assessment of density and dimensions of the nodes of Ranvier see Figure 2—figure supplement 3.

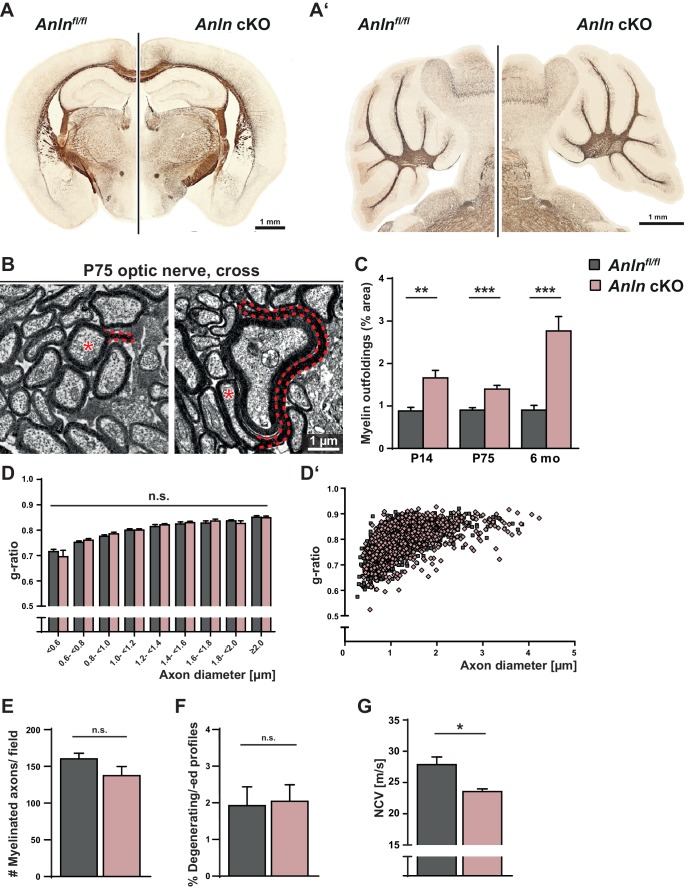
Figure 2.

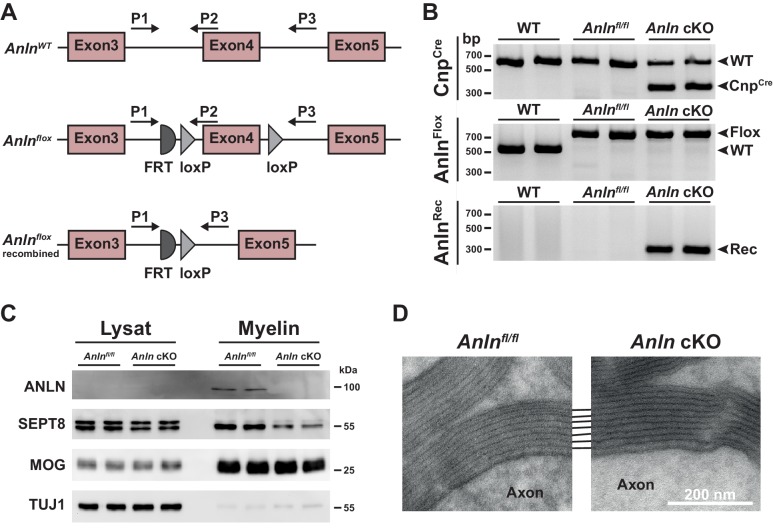
Figure 2—figure supplement 1. Generation of mice lacking expression of ANLN from myelinating oligodendrocytes (Anln cKO mice).

Figure 2—figure supplement 1.

(A) Scheme of the wild type (WT) Anln gene and the engineered Anln allele before and after recombination. Exon 4 of the Anlnflox-allele is flanked by loxP-sites (floxed) for Cre-mediated recombination. Positions of PCR primers (P1, P2, P3) are indicated. (B) Genotyping PCR of DNA isolated from mouse tail tips identifies the indicated alleles. Gel shows n = 2 mice per genotype. (C) Immunoblot analysis of brain lysates and myelin purified from P75 control (Anlnfl/fl) and Anlnfl/fl;CnpCre/WT (Anln cKO) mice. Note that ANLN is only detectable in myelin purified from the brains of control mice. Note that the abundance of SEPT8 is reduced in myelin purified from Anln cKO compared to control mice. MOG and TUJ1 were detected as controls. Blot shows n = 2 mice per genotype. (D) Electron micrographs of optic nerves at eight mo indicates unaltered myelin periodicity and compaction in Anln cKO mice. Representative of three mice per genotype.

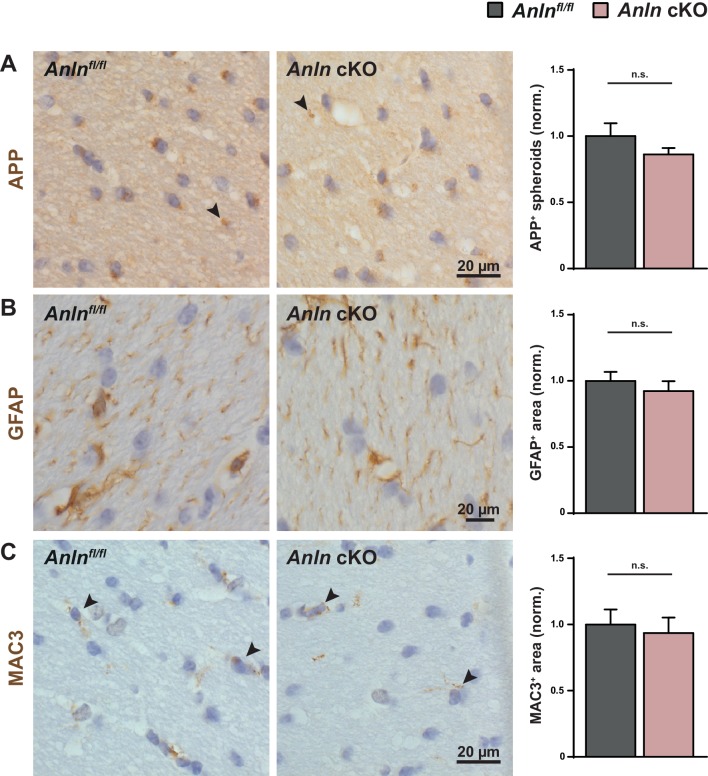
Figure 2—figure supplement 2. ANLN deficiency in oligodendrocytes does not cause axonopathy, astrogliosis or microgliosis.

Figure 2—figure supplement 2.

(A–C) Immunohistochemical analysis of APP-immunopositive axonal spheroids (arrowheads in A), GFAP-immunopositive astrocytes (B) and MAC3-immunopositive microglia (arrowheads in C) in the white matter (hippocampal fimbria) of control (Anlnfl/fl) and Anlnfl/fl;CnpCre/WT mice (Anln cKO) at P75 and genotype-dependent quantification. (A) Frequency of occurrence of APP immunopositive spheroids not significant (n.s.) according to unpaired two-tailed t-test; n = 5 mice per genotype; p=0.2418. (B) Relative area of GFAP-immunopositivity not significant (n.s.) according to unpaired two-tailed t-test; n = 5 mice per genotype; p=0.4704. (C) Relative area of MAC3-immunopositivity not significant (n.s.) according to unpaired two-tailed t-test; n = 5 mice per genotype; p=0.7047.

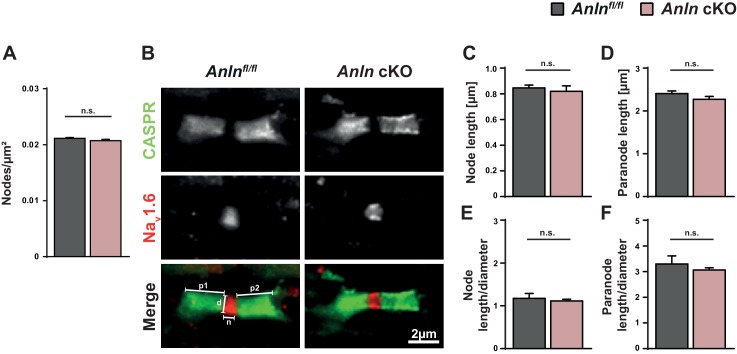
Figure 2—figure supplement 3. ANLN deficiency in oligodendrocytes does not cause alterations of density or structure of nodes of Ranvier.

Figure 2—figure supplement 3.

(A) Genotype-dependent quantification of the density of nodes of Ranvier on longitudinal spinal cord sections of control (Anlnfl/fl) and Anln cKO mice at P75 based on immunohistochemical analysis detecting the sodium channel Nav1.6 as a marker. not significant (n.s.) according to unpaired two-tailed t-test; n = 4 mice per genotype; p=0.1985. (B–F) Immunohistochemical detection of the nodal marker Nav1.6 (red) and the paranodal marker CASPR (green) on longitudinal spinal cord sections of control (Anlnfl/fl) and Anln cKO mice at P75. Parameters measured for quantifications displayed in (C–F) are indicated in the merge of the control (in B). p1/p2 = paranode length; d = axonal diameter at node; n = node length. (C) Genotype-dependent quantification of node length. Not significant (n.s.) according to unpaired two-tailed t-test; n = 4–5 mice per genotype; p=0.6324. (D) Genotype-dependent quantification of paranode length. Not significant (n.s.) according to unpaired two-tailed t-test; n = 4–5 mice per genotype; p=0.1927. (E) Ratio of node length and axonal diameter. Not significant (n.s.) according to unpaired two-tailed t-test; n = 4–5 mice per genotype; p=0.5966. (F) Ratio of paranode length and axonal diameter. Not significant (n.s.) according to unpaired two-tailed t-test; n = 4–5 mice per genotype; p=0.4603.