. 2019 Jan 23;8:e43888. doi: 10.7554/eLife.43888

Figure 3. Myelin composition in mice lacking oligodendroglial expression of ANLN.

(A) Volcano plot summarizing genotype-dependent quantitative myelin proteome analysis. Data points represent quantified proteins in myelin purified at P75 from the brains of Anln cKO compared to Anlnfl/fl mice (n = 3 mice per genotype). Data points are plotted as log2-transformed fold-change (FC) on the x-axis against the −log10-transformed q-value on the y-axis. The horizontal red dashed line indicates a q-value of q = 0.01; the vertical black dashed lines mark the ±1 log2 fold-change threshold indicating a halved or doubled abundance of a protein in myelin, respectively. Data points representing myelin septin monomers (SEPT2, SEPT4, SEPT7, SEPT8) are highlighted in light red color with protein names given; note that their abundance is strongly reduced in Anln cKO compared to Anlnfl/fl myelin. Also note that ANLN is not represented because it was not detected in Anln cKO myelin. For bar graphs showing genotype-dependent comparison of the abundance of individual proteins in myelin see Figure 3—figure supplement 1A–D. For the original dataset and exact q-values see Figure 3—source data 1. (B) Immunoblotting validates the lack of anillin (ANLN) and the strong reduction of septins (SEPT2, SEPT4, SEPT7, SEPT8) in myelin purified from the brains of Anln cKO-mice. ATPase Na+/K + transporting subunit alpha 3 (ATP1A3) was detected as control. Blot shows n = 3 mice per genotype. (C) Immunoblotting indicates that the abundance of classical myelin proteins (PLP/DM20, SIRT2, CD9, CA2) is unaltered in myelin purified from the brains of Anln cKO-mice. ATP1A1 served as control. Blot shows n = 3 mice per genotype. (D) Genotype-dependent quantitative assessment of PtdIns(4,5)P2 (PIP2)–levels in myelin purified from the brains of Anln cKO-mice compared to controls (Anlnfl/fl) at P75. Mean +/SEM. n = 6 mice per genotype; two-tailed unpaired t-test; PtdIns(4,5)P2p=0.0435. (E) qRT-PCR to determine the abundance of mRNAs encoding anillin and myelin septins in the white matter (corpus callosum) of control (Anlnfl/fl) versus Anln cKO-mice. Note that Anln mRNA was virtually undetectable in Anln cKO-mice while the abundances of Sept2, Sept4, Sept7 and Sept8 mRNAs were unaltered. Mean +/SEM. n = 6 mice per genotype; two-way ANOVA; Anln p<0.0001, Sept2 p>0.9999, Sept4 p>0.9999, Sept7 p>0.9999, Sept8 p>0.9999.

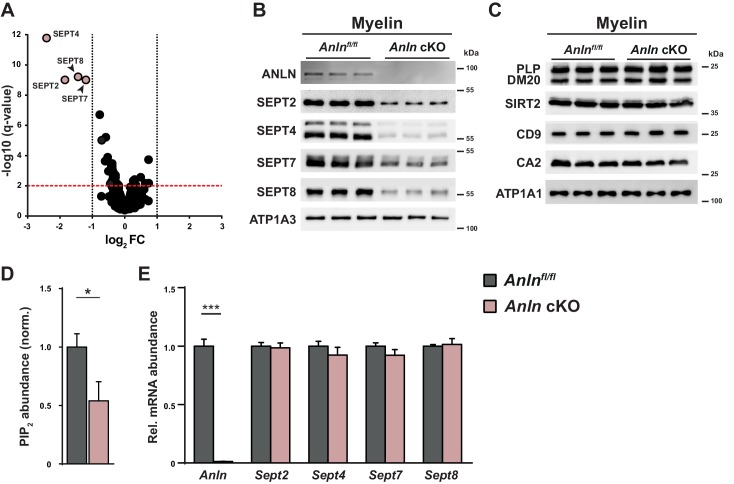
Figure 3—source data 1. Label-free quantification of proteins in myelin purified from the brains of Anln cKO and control mice Tryptic peptides derived from two technical replicates (replicate digestion) per biological replicate (n = 3 mice per genotype) were analyzed by LC-MS (12 runs in total).
Proteins (FDR < 1%; two peptides/protein) and peptides (FDR < 1%;≥6 amino acids) were identified by database search against the UniprotKB/SwissProt mouse database using PLGS. Data were post-processed with the software package ISOQuant to calculate absolute in-sample amounts for each detected protein based on the TOP3 approach. Reported abundance values are defined as the relative amount of each protein in respect to the sum over all detected proteins (ppm: parts per million (w/w) of total protein). The typical contaminant proteins trypsin and keratins were filtered. One technical replicate of a control sample was identified as outlier based on its low correlation coefficient of ≤0.76 (all other runs ≥ 0.95) and thus excluded from analysis.
elife-43888-fig3-data1.xlsx (147.2KB, xlsx)
DOI: 10.7554/eLife.43888.010

Figure 3.

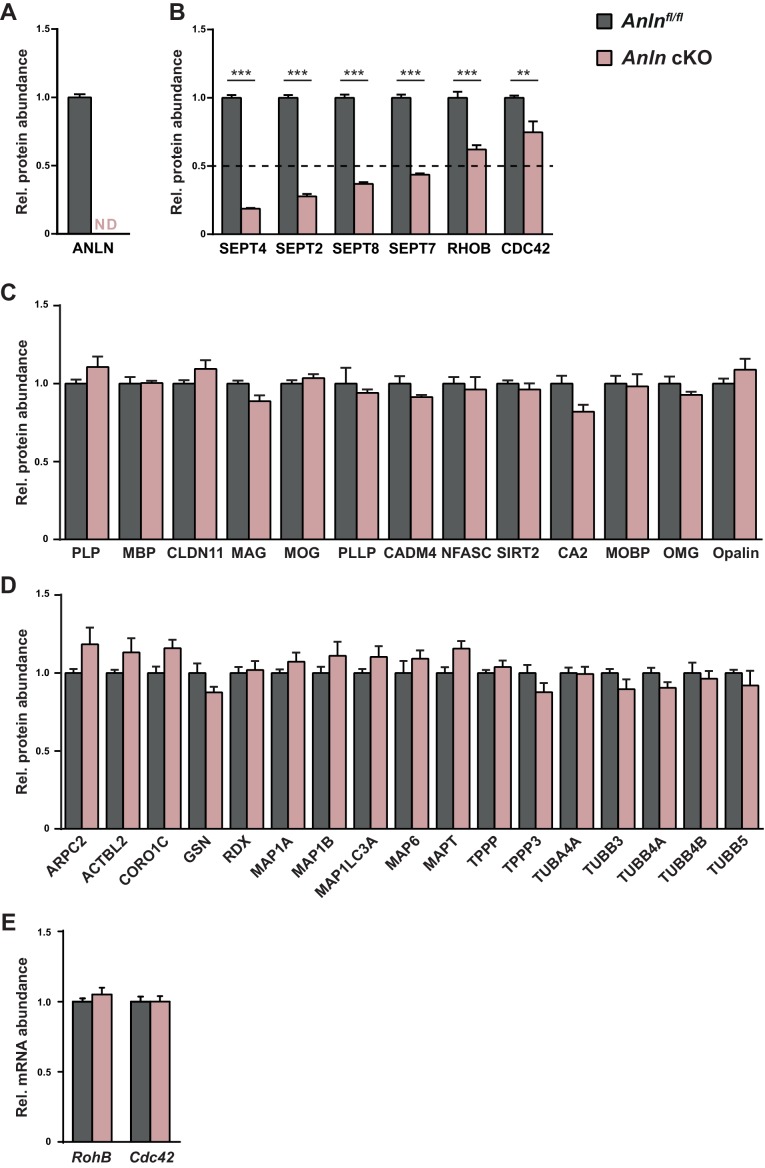
Figure 3—figure supplement 1. Genotype-dependent quantification of selected proteins according to myelin proteome analysis.

Figure 3—figure supplement 1.

(A) Differential myelin proteome analysis indicates that ANLN is readily identified in myelin purified from the brains of control mice at P75 but undetectable in Anlnfl/fl;CnpCre/WT (Anln cKO)-myelin. Mean +/SEM; n = 3 mice per genotype. (B) Differential myelin proteome analysis reveals that the abundance of myelin septins (SEPT2, SEPT4, SEPT7, SEPT8) is diminished in myelin purified from Anln cKO-mice at P75 compared to Anlnfl/fl mice. The abundance of the putative septin-associated proteins RHOB and CDC42 is also significantly reduced in Anln cKO-myelin, although to a lesser degree. The horizontal black dashed line marks a threshold indicating halved abundance of a protein in myelin. Mean +/SEM; n = 3 mice per genotype; For q-values as calculated by R data analysis (see Materials and Methods for details) see Figure 3—source data 1. (C) Differential myelin proteome analysis indicates that the abundance of classical myelin proteins is unaltered in Anln cKO-myelin. Mean +/SEM. n = 3 mice per genotype; not significant according to q-value calculation using R (see Materials and Methods for details); for exact q-values see Figure 3—source data 1. (D) By differential myelin proteome analysis, the abundance of cytoskeletal proteins is unaltered in Anln cKO-myelin, except for myelin septins and septin-associated proteins as highlighted in (B). Mean +/SEM. n = 3 mice per genotype; not significant according to q-value calculation using R; for exact q-values see Figure 3—source data 1. (E) qRT-PCR to determine the abundance of mRNAs encoding putative septin-associated proteins RHOB and CDC42 in the white matter (corpus callosum) of control (Anlnfl/fl) versus Anln cKO-mice. Note that Rhob and Cdc42 mRNAs were unaltered in abundance. Mean +/SEM. n = 6 mice per genotype; two-way ANOVA; RhoB p>0.9999, Cdc42 p>0.9999.