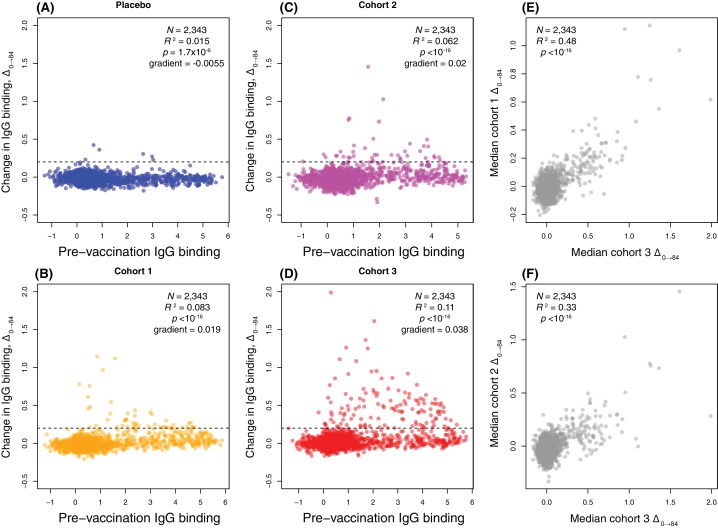
Figure 3. Scatterplots showing the within-cohort median change in IgG binding to each probe over the course of the trial (Δ0→84) relative to the within-cohort median pre-vaccination IgG binding.
(A–D) This relationship is shown for each probe on the proteome array using data from the 29 individuals with samples taken at the start and end of the trial. These are split into (A) the placebo group, (B) cohort 1 (100 μg doses), (C) cohort 2 (300 μg doses), and (D) cohort 3 (600 μg doses). The horizontal dashed line indicates the empirically-determined threshold for defining probes having undergone a substantial change in IgG binding during the trial (Figure 4—figure supplement 2). The Pearson’s correlation statistics and gradient of the best-fitting linear model are annotated on each panel. (E–F) The relationship between the median Δ0→84 for each probe is shown for (E) a comparison of cohorts 1 and 3, and (F) a comparison of cohorts 2 and 3.

