. 2018 Dec 28;7:e37015. doi: 10.7554/eLife.37015

Figure 4. Identification of WCV antigens from changes in IgG binding.

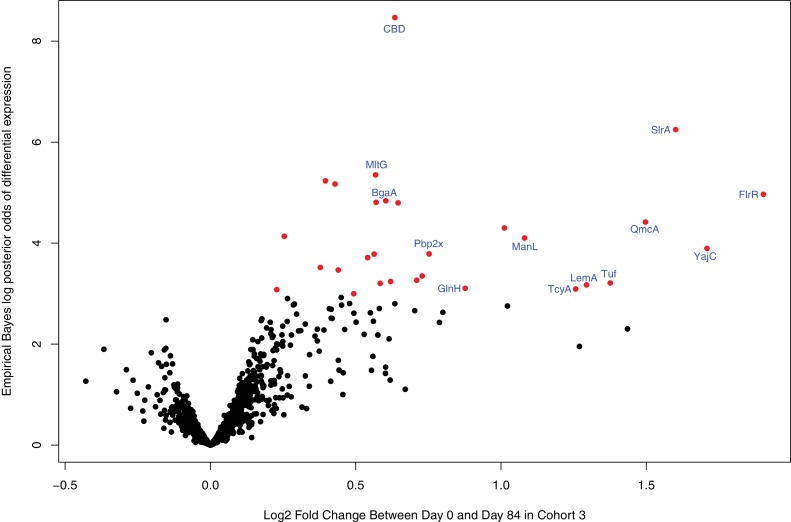
(A) Violin plots showing the median Δ0→84 within cohort three for non-DCL array probes, split by whether they represent proteins with close orthologues in the WCV strain RM200 (defined as ≥90% amino acid identity) or not. The central panel shows the same comparison, but further constraining the dataset to probes representing the proteins classified as ABTs based on high pre-vaccination IgG binding. The right panel stratifies the 87 probes corresponding to ABTs with close orthologues in RM200 by whether the protein on the array was also conserved with ≥90% sequence identity in S. mitis and S. pseudopneumoniae (Supplementary file 1). The number of probes in each category is shown at the top of the plot. The results of Wilcoxon rank sum tests (W) and significance (p) are annotated on each panel. (B) Volcano plot showing the statistical and biological significance of changes in IgG binding following WCV administration in cohort 3. The horizontal axis shows the fold change in IgG binding between the day zero and day 84 samples from cohort three on a base two logarithmic scale. The vertical axis shows the B statistic from the empirical Bayes analysis, representing the natural logarithm of the odds ratio of differential IgG binding between cohort three and the placebo group. Points corresponding to array probes with a Benjamini-Hochberg corrected p value below 0.05 are coloured red, unless they represent a variant of PspA, PspC, ZmpA, or ZmpB. (C) Functional categorisation of antigens. The distribution of ABTs, defined as eliciting high IgG in the pre-vaccination samples (Croucher et al., 2017), and the WCV antigens identified by either the eBayes or LMM analyses (Supplementary file 2) are compared across different functional categories.

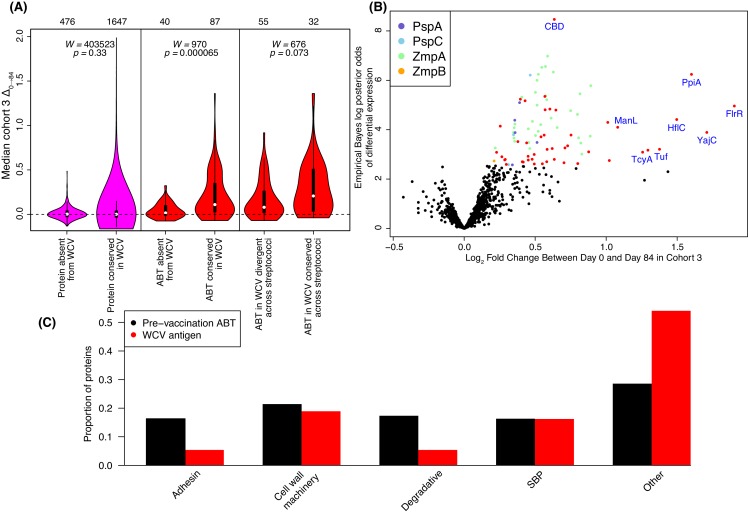
Figure 4.

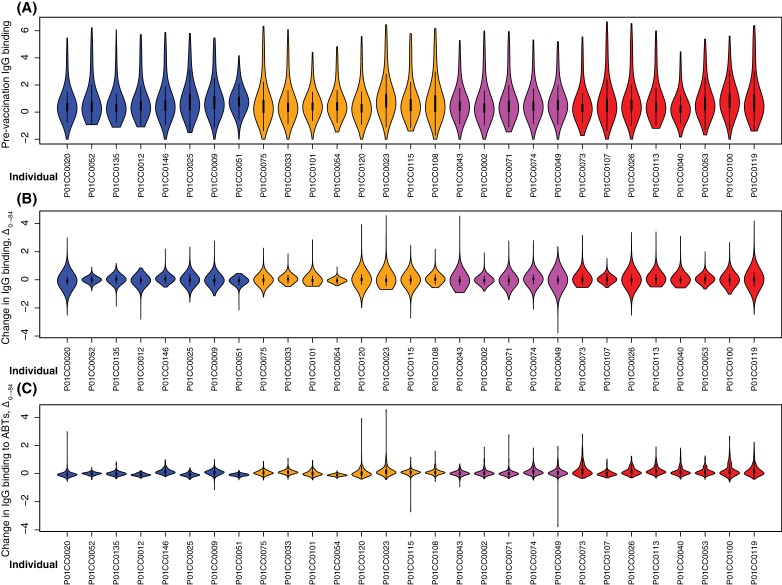
Figure 4—figure supplement 1. Variation in IgG binding between individuals.

Figure 4—figure supplement 1.

Each panel includes a violin plot for each of the 29 individuals sampled at the start and end of the trial. Each plot is coloured according to the cohort to which the individual belonged. (A) Violin plots showing the distribution of IgG-binding measurements at day zero. No significant heterogeneity between the median IgG values per individual was detected between cohorts (Kruskal-Wallis test, N = 29, χ2 = 0.20, df = 3, p = 0.98), or in a pairwise comparison of cohort three with the placebo group (Wilcoxon rank sum test, N = 16, W = 34, p = 0.88). (B) Violin plots showing Δ0→84 for all of the probes included in the analysis. No significant heterogeneity between the median IgG values per individual was detected between cohorts (Kruskal-Wallis test, N = 29, χ2 = 3.17, df = 3, p = 0.37), or in a pairwise comparison of cohort three with the placebo group (Wilcoxon rank sum test, N = 16, W = 20, p = 0.23). (C) Violin plots showing the same data as in panel (B), but only for the 325 probes from the antibody-binding targets (ABTs) defined by their high pre-vaccination IgG binding. No significant heterogeneity between the median IgG values per individual was detected between cohorts (Kruskal-Wallis test, N = 29, χ2 = 4.63, df = 3, p = 0.20), nor did a pairwise comparison of cohort three with the placebo group suggest vaccination caused a significant increase in overall IgG binding across all ABTs (Wilcoxon rank sum test, N = 16, W = 14, p = 0.065).
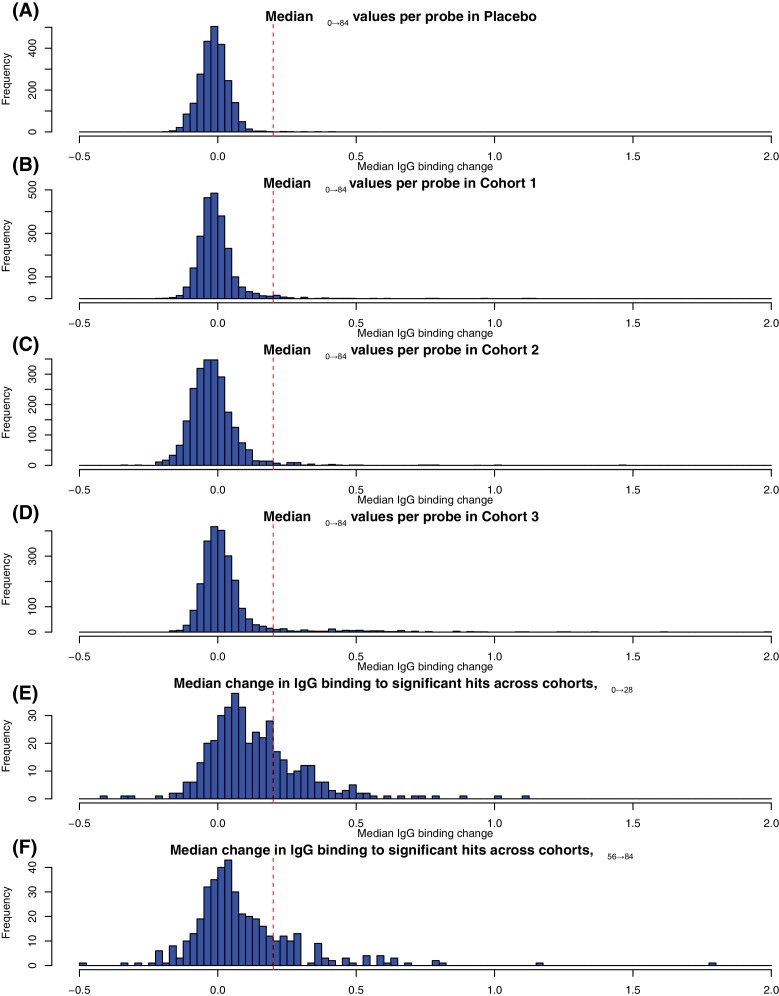
Figure 4—figure supplement 2. Determining the threshold for identifying substantial changes in IgG binding between timepoints.

Figure 4—figure supplement 2.

The first four histograms in panels (AD) show the distribution of Δ0→84 values across all probes for the four cohorts in the trial. The threshold of 0.2 separates the main distribution of small Δ0→84 values from the outliers associated with immunogenic proteins in the WCV. This threshold is marked on Figure 3. The last two histograms in panels (E-F) show the distribution of changes in IgG binding between the (E) first two (Δ0→28) and (F) last two (Δ56→84) timepoints for the individuals in the vaccinated cohorts in whom all four timepoints were sampled. Only probes identified as undergoing a significant change based on the eBayes or LMM analyses were included in the plots, resulting in an enrichment of larger changes in IgG binding. Based on these, the same threshold of 0.2 units was selected as distinguishing the set of probes detecting a change in the specified interval from those detecting changes over other time periods. This threshold is marked on Figure 7.
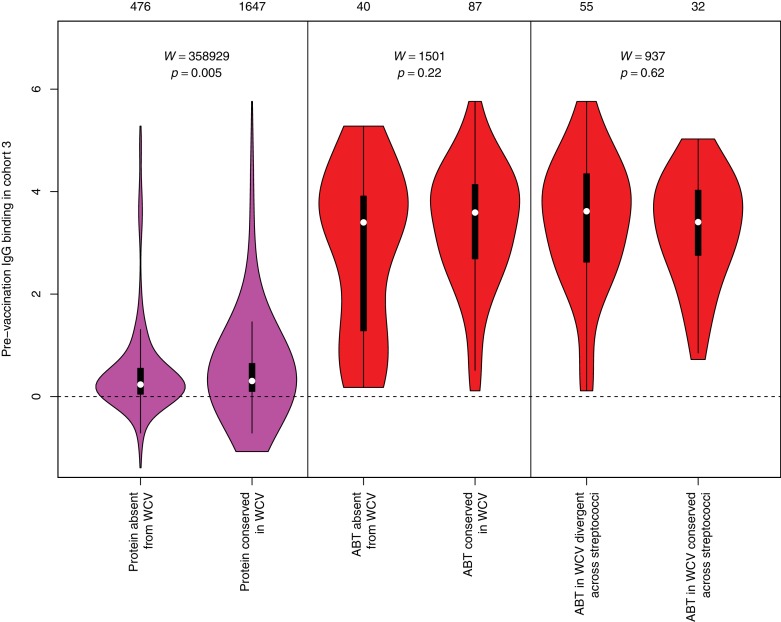
Figure 4—figure supplement 3. Pre-vaccination IgG binding in cohort three to protein categories defined in Figure 4.

Figure 4—figure supplement 3.

The left violin plot shows the distribution of pre-WCV IgG binding in cohort three for non-DCL array probes, split by whether they represent proteins with close orthologues in the WCV strain RM200 (defined as ≥90% amino acid identity) or not. The responses to the proteins in the vaccine are slightly higher prior to administration, which may reflect the rarity of those proteins absent from RM200; such low frequency proteins are less likely to have triggered a recent immune response. The central panel shows the same comparison of pre-vaccination immune responses, but further constraining the dataset to probes representing the proteins classified as ABTs based on high pre-vaccination IgG binding. The right panel stratifies the 87 probes corresponding to ABTs with close orthologues in RM200 by whether protein on the array is also conserved with ≥90% sequence identity in S. mitis and S. pseudopneumoniae. The number of probes in each category is shown at the top of the plot. The results of Wilcoxon rank sum tests (W) and the associated statistical significance (p) are annotated on each panel.
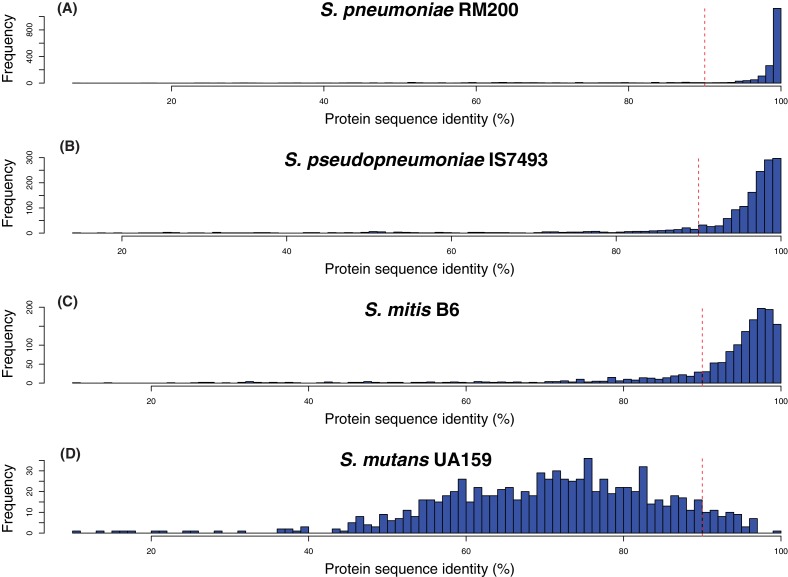
Figure 4—figure supplement 4. Sequence identity between proteomes of different species.

Figure 4—figure supplement 4.

Each histogram shows the pairwise protein sequence identity between the proteins on the array, and the closest orthologues in the corresponding genome. Data are shown for (A) S. pneumoniae RM200, the strain on which the vaccine is based; (B) S. pseudopneumoniae IS7493, a representative of the species most closely-related to S. pneumoniae; (C) S. mitis B6, a representative of the diverse species after which the mitis group streptococci (of which S. pneumoniae is one) is named; (D) S. mutans UA159, which was found to be too divergent for an informative analysis to be performed. The vertical red dashed line indicates the empirically-determined 90% sequence identity threshold for determining presence in, or absence from, RM200 in Figure 4A and Figure 4—figure supplement 3. Altering this threshold to 95% did not substantially alter the results presented in these figures.
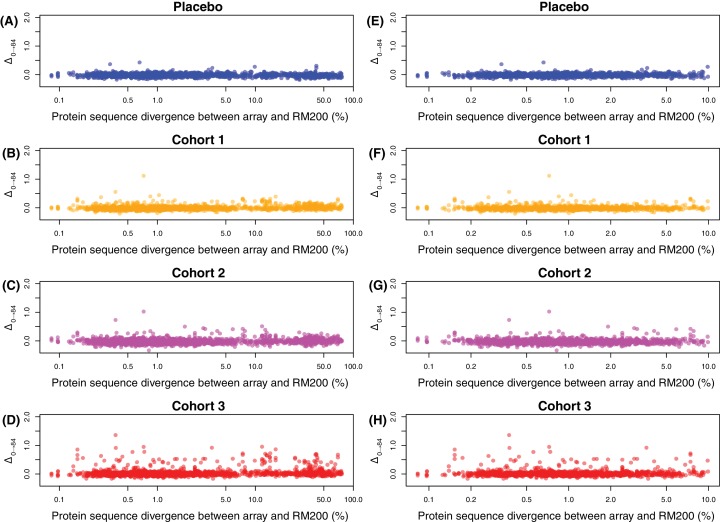
Figure 4—figure supplement 5. Effect of divergence between array sequences and RM200 proteins on detected changes in IgG binding.

Figure 4—figure supplement 5.

Each panel shows the divergence between the protein sequence on the array and the closest orthologue in the RM200 strain, on a logarithmic scale on the horizontal axis, and the within-cohort median Δ0→84, on the vertical axis. Two plots are shown for each cohort, focussing on different ranges of sequence similarity: between 0–100% divergence (A–D), and 0–10% divergence (E–H). No clear relationship between sequence divergence and change in IgG binding is evident, suggesting measurements from the array are not biased towards the probes sharing higher sequence identity with proteins in the WCV, despite being designed using a divergent set of strains.
Figure 4—figure supplement 6. Volcano plot showing the statistical and biological significance of changes in IgG binding following WCV administration in cohort 3, when the DCL probes are excluded from the eBayes analysis.

Figure 4—figure supplement 6.

Data are presented as described for Figure 4B. Points corresponding to array probes with a Benjamini-Hochberg corrected p value below 0.05 are coloured red.
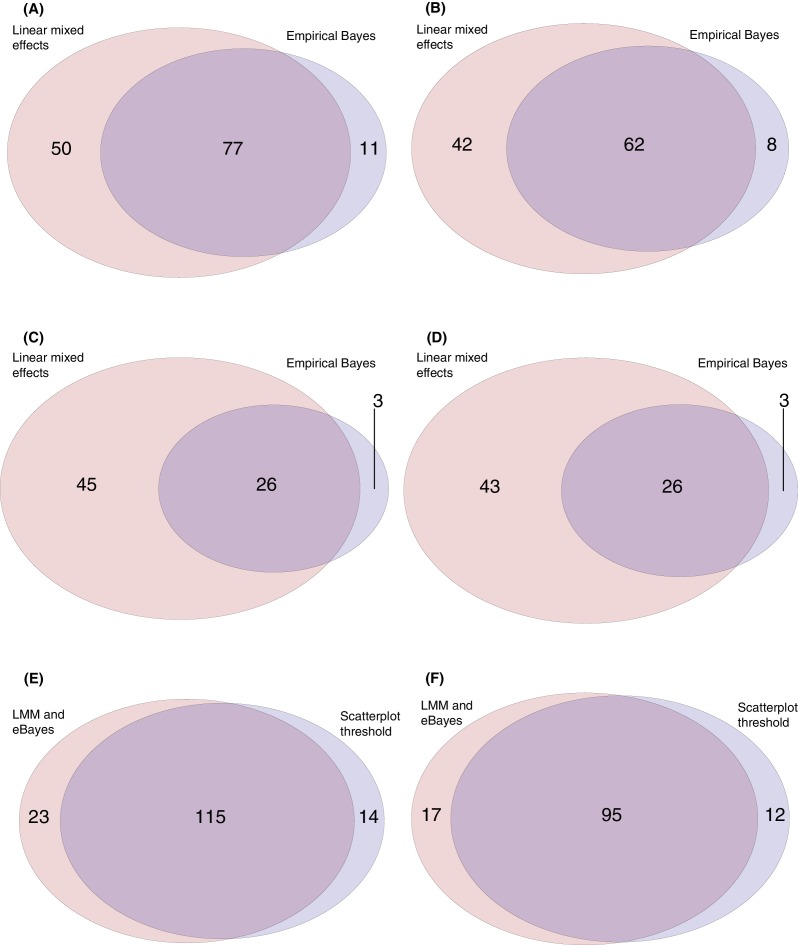
Figure 4—figure supplement 7. Venn diagrams comparing the results of the empirical Bayes analysis, linear mixed effects models, and empirically-derived threshold applied to theΔ0→84 values shown on the scatterplots in Figure 3.

Figure 4—figure supplement 7.

The threshold approach, and empirical Bayes model, were applied to identify the array probes to which elevated IgG responses were evident between the first and final timepoints for the 29 individuals for whom these data were available. The linear mixed effects model was applied to identify the probes to which there was an increasing IgG response across the four timepoints for the 20 individuals in vaccinated cohorts for whom a complete set of longitudinal samples were available. (A) This Venn diagram shows the linear mixed effects model identified a greater number of probes (127) than the empirical Bayes analysis (88), but the majority of probes identified by either method were consistent with the other. (B) This Venn diagram combines probes corresponding to different parts of the same protein into single datapoints. This shows relatively few proteins were only supported by one of the two methods. Panels (C) and (D) show the same comparisons for the analyses excluding the DCL probes. For panels (E) and (F), the 138 probes identified by either the linear mixed effects models or empirical Bayes analyses were compared against the 129 probes identified as exceeding the threshold Δ0→84 value of 0.2 in cohort 3 (Figure 3D). (C) This Venn diagram shows the model fitting results are highly consistent with those from the threshold-based approach. (D) This Venn diagram combines probes corresponding to different parts of the same protein into single datapoints, showing the results are similar as to panel (C).
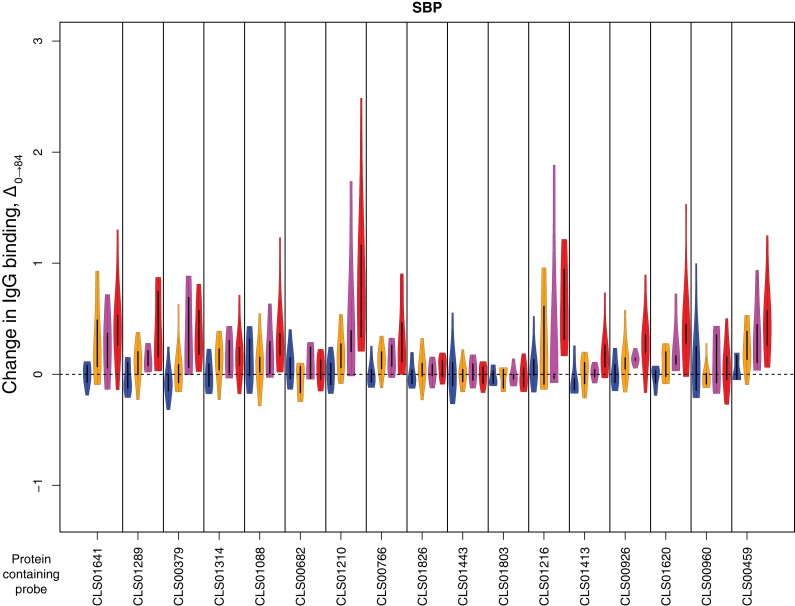
Figure 4—figure supplement 8. Change in IgG binding during the trial for solute- binding proteins defined as antibody-binding targets on the basis of high pre-vaccination IgG binding.

Figure 4—figure supplement 8.

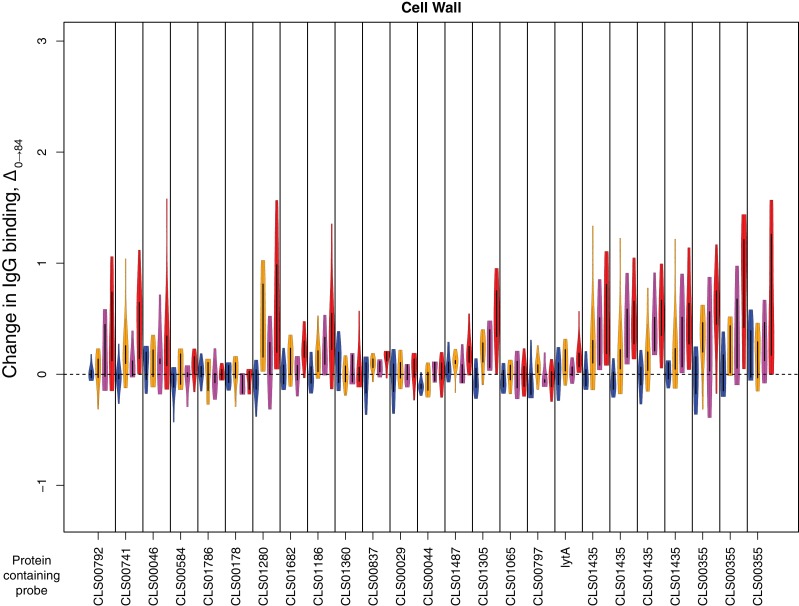
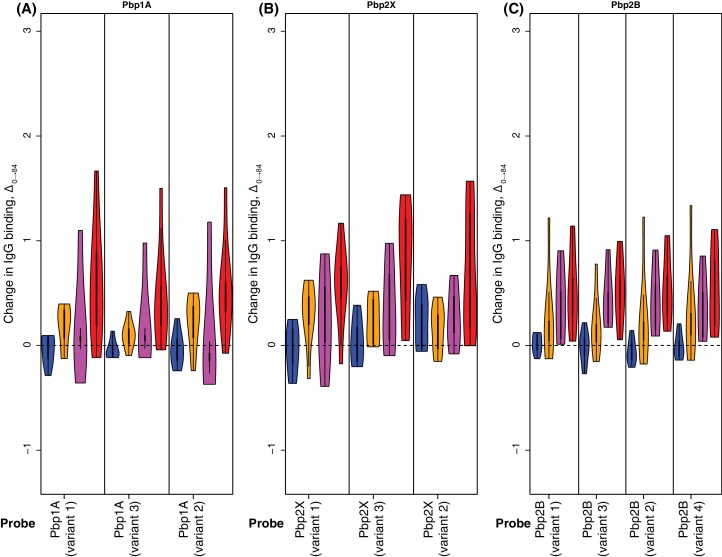
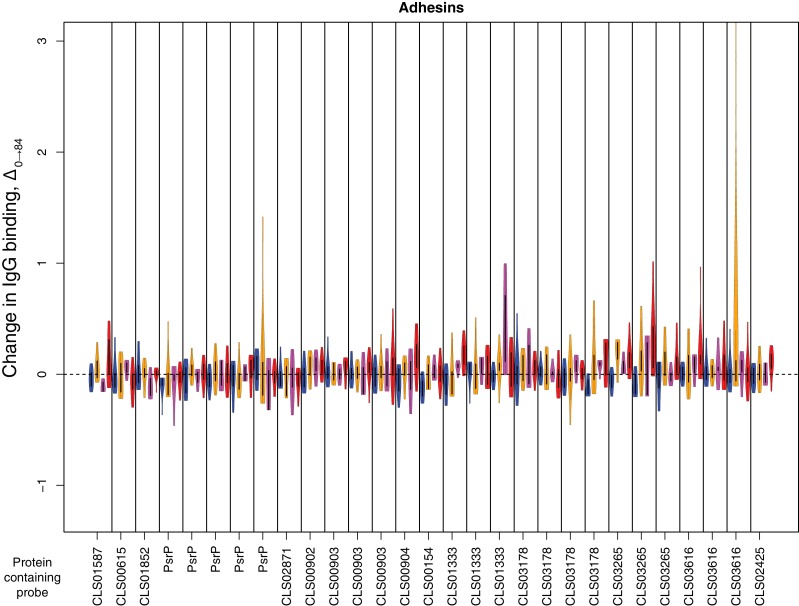
In each plot, vertical bars separate data for different probes. The protein to which the probe corresponds is labelled at the bottom of the graph. The four violin plots show Δ0→84 for each of the four cohorts: placebo in blue, cohort one in orange, cohort two in pink, and cohort three in red. Only data from the 29 individuals for whom samples were available from the start and end of the trial were used.
Figure 4—figure supplement 9. Change in IgG binding during the trial for cell wall synthesis and processing machinery proteins defined as antibody-binding targets on the basis of high pre-vaccination IgG binding.

Figure 4—figure supplement 9.

Data are displayed as described in Figure 4—figure supplement 8.
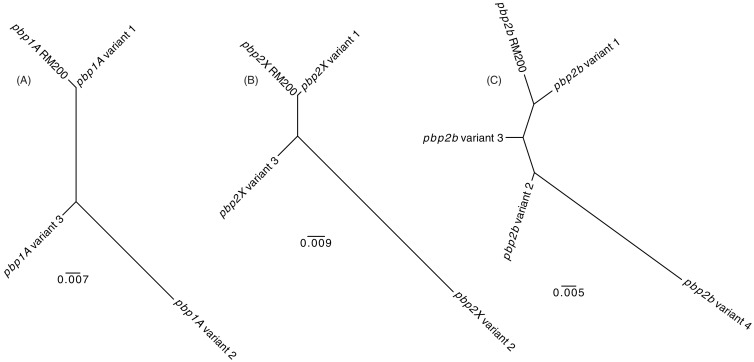
Figure 4—figure supplement 10. Maximum likelihood phylogenetic analysis of the S.

Figure 4—figure supplement 10.

pneumoniae RM200 penicillin-binding proteins and orthologous variants on the proteome array. (A) Phylogeny demonstrating Pbp1A from RM200 is most similar to variant one on the array. (B) Phylogeny demonstrating Pbp2X from RM200 is most similar to variant one on the array. (C) Phylogeny demonstrating Pbp2B from RM200 is most similar to variant one on the array.
Figure 4—figure supplement 11. Changes in IgG binding to penicillin-binding protein variants.

Figure 4—figure supplement 11.

Data are shown as described in Figure 4—figure supplement 8.
Figure 4—figure supplement 12. Change in IgG binding during the trial for adhesin proteins defined as antibody-binding targets on the basis of high pre-vaccination IgG binding.

Figure 4—figure supplement 12.

Data are displayed as described in Figure 4—figure supplement 8.
Figure 4—figure supplement 13. Maximum likelihood phylogenetic analysis of the S.

Figure 4—figure supplement 13.

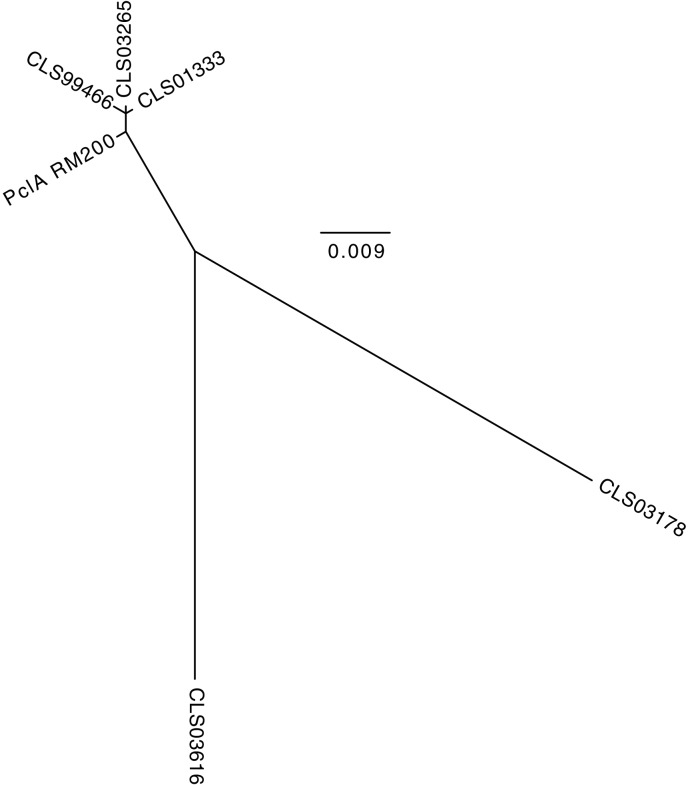
pneumoniae RM200 PclA sequence and the orthologous proteins on the proteome array. The tree shows that the RM200 protein is most similar to CLS01333 and CLS03265, as well as the truncated non-functional variant CLS99466. The CLS03616 and CLS03178 variants are highly diverged from the variant expressed by RM200.
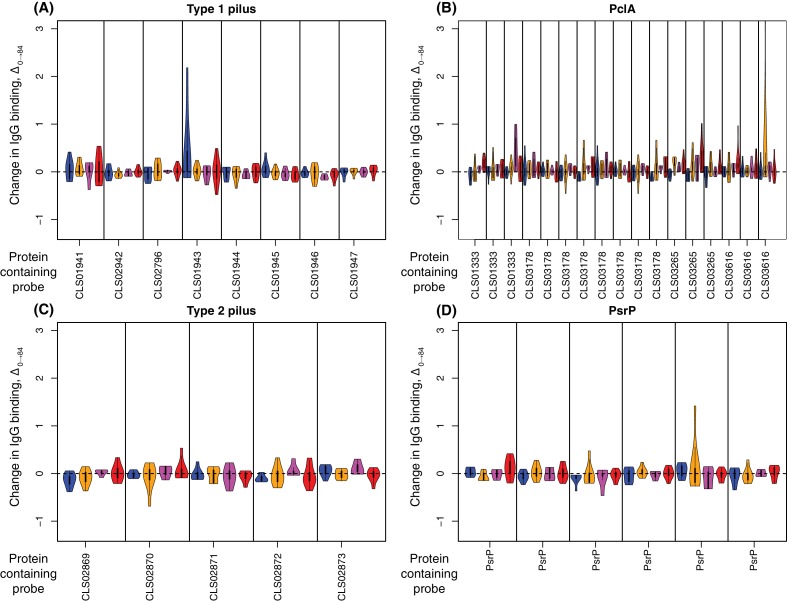
Figure 4—figure supplement 14. Change in IgG binding to large antigenic structures.

Figure 4—figure supplement 14.

Data are shown as in Figure 4—figure supplement 8. The type one and two pili, and the pneumococcal serine-rich repeat protein (PsrP), are all absent from S. pneumoniae RM200, and therefore WCV is not expected to trigger an elevated IgG response to these structures. The PclA variants CLS01333 and CLS03265 show some evidence of increased IgG binding, indicating the S. pneumoniae RM200 PclA protein is being recognised by WCV-induced antibodies.
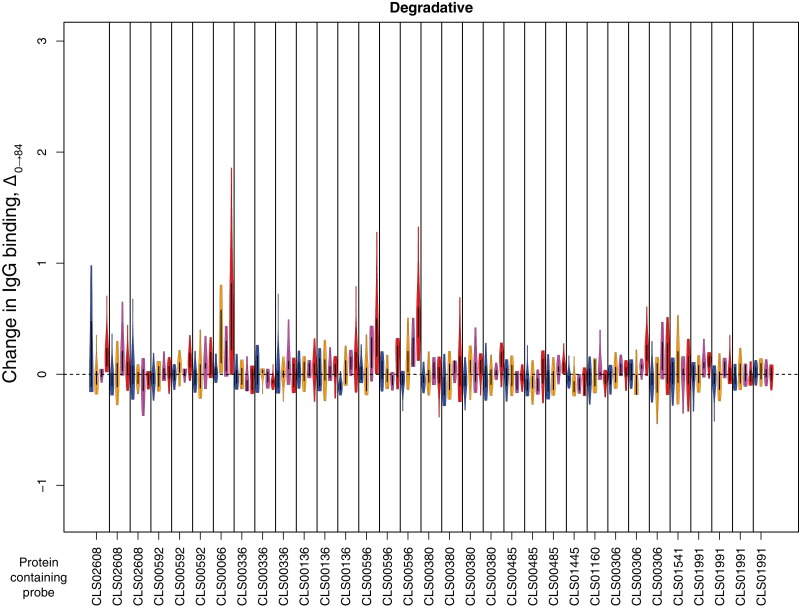
Figure 4—figure supplement 15. Change in IgG binding during the trial for surface-associated degradative enzymes defined as antibody-binding targets on the basis of high pre-vaccination IgG binding.

Figure 4—figure supplement 15.

Data are displayed as described in Figure 4—figure supplement 8.