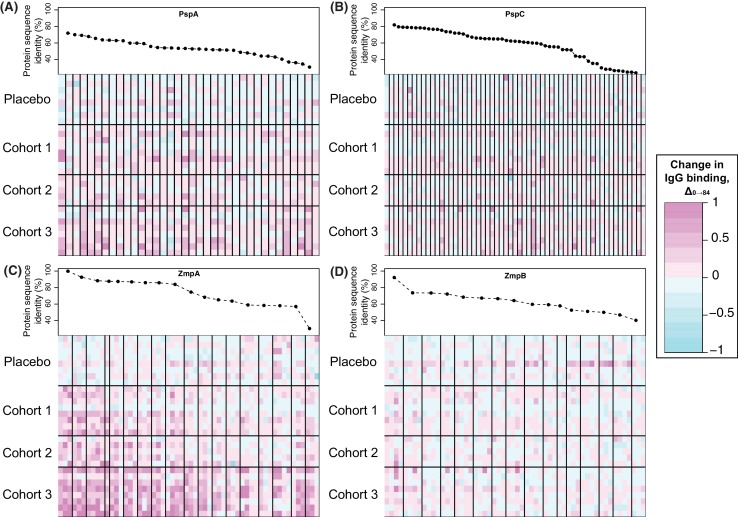
Figure 5. Changes in IgG binding to diverse core loci.
Each heatmap has a row for each of the 29 trial participants with samples at the start and end of the trial, ordered by cohort. Each column represents a probe on the proteome array, with vertical black bars separating the probes from different variants. The cells are coloured by the direction and magnitude of Δ0→84, with increasingly strong cyan representing reduced IgG binding over the duration of the trial, and increasingly strong magenta representing elevated IgG binding. The variants are ordered according to their similarity to the corresponding sequence in the WCV, with the most similar on the left, and least similar on the right. (A) Heatmap showing Δ0→84 for pneumococcal surface protein A (PspA) variants. (B) Heatmap showing Δ0→84 for pneumococcal surface protein C (PspC) variants. (C) Heatmap showing Δ0→84 for zinc metalloprotease A (ZmpA) variants. The large zinc metalloprotease proteins are typically represented by multiple probes. (D) Heatmap showing Δ0→84 for zinc metalloprotease B (ZmpB) variants.

