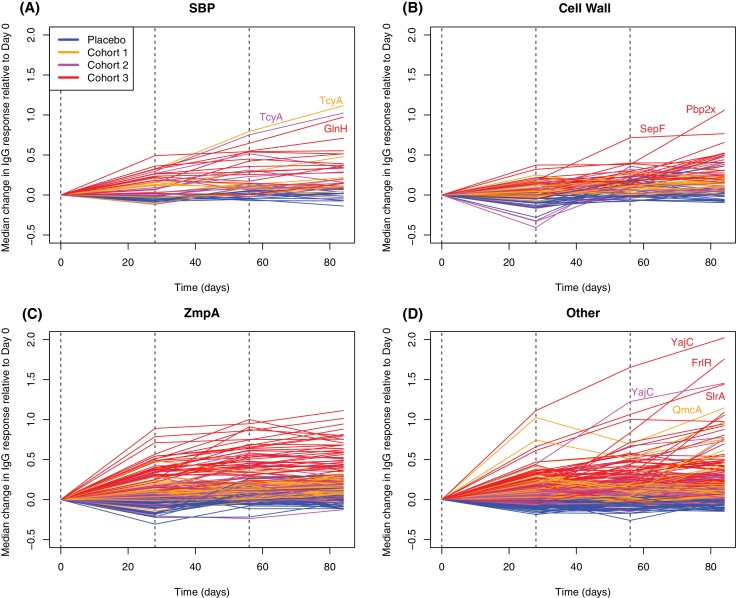
Figure 6. Longitudinal responses to successive WCV doses.
These plots show the within-cohort median change in IgG binding, relative to the level in the pre-vaccination sample, using data from the 27 individuals with samples taken at all four timepoints. The probes are functionally grouped as described in Supplementary file 2: (A) solute-binding proteins; (B) proteins involved in cell wall metabolism; (C) zinc metalloprotease A variants; and (D) other core proteins. Only probes found to have a significant increase in IgG binding after WCV administration by eBayes or LMM analyses are included. Between each sampled timepoint, the solid lines join the median IgG-binding values for the cohort indicated by their colour. Vertical dashed lines show times of WCV administration.

