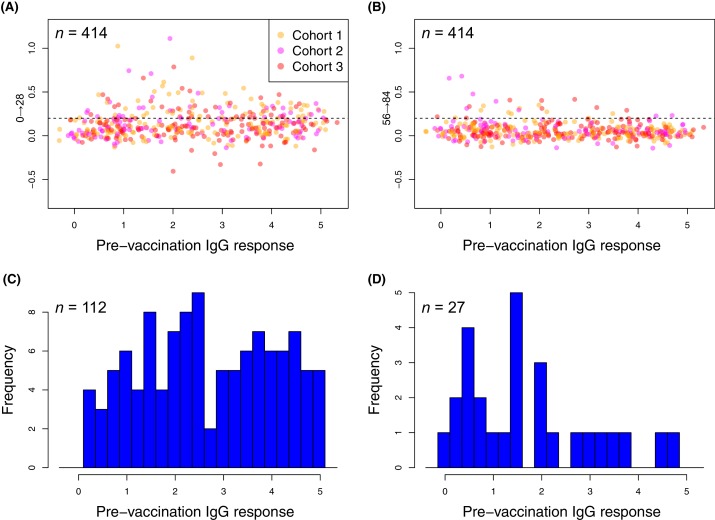
Figure 7. Changes in the within-cohort median IgG binding between consecutive timepoints.
(A and B) The scatterplots show 414 points, corresponding to the 138 probes found to have a significant increase in post-WCV IgG binding by the eBayes or LMM analyses in each of the three vaccinated cohorts, as no induced immunity is expected in the placebo group. The horizontal dashed line represents the empirically-determined threshold of 0.2 used for identifying those probes associated with an atypically large change in IgG binding between successive timepoints. Points are coloured according to the cohort from which they derive, as indicated by the key. Panel (A) shows the within-cohort median changes in IgG binding following the first inoculation (Δ0→28) relative to the within-cohort median pre-vaccination level of IgG binding. Panel (B) shows the equivalent plot following the third inoculation (Δ56→84). (C and D) For the responses (defined by probe and cohort) exceeding the specified threshold, the corresponding pre-vaccination IgG-binding values are shown by the histograms of within-cohort median IgG binding at day 0. Panel (C) shows the 112 high responses to the first WCV dose (Δ0→28 > 0.2) span the full range of pre-vaccine IgG-binding values, whereas panel (D) shows the 27 high responses to the third WCV dose (Δ56→84 > 0.2) are typically associated with low pre-vaccine IgG binding.

