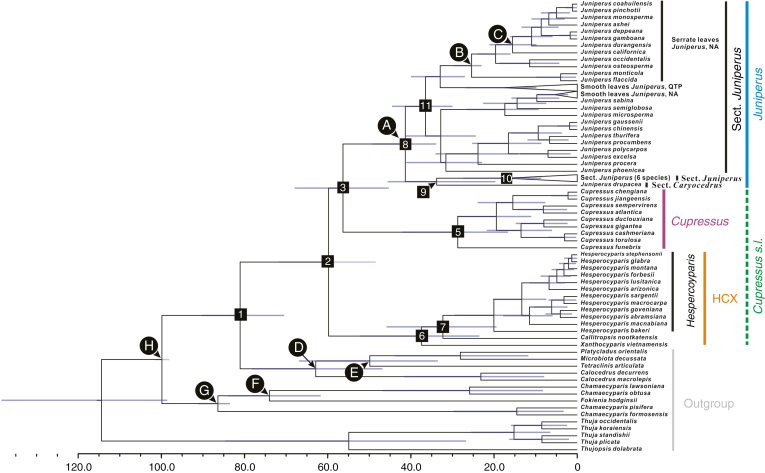
Fig. 4.
Evolutionary divergence time scale of Cupressoideae based on the ptDNA data set (86 accessions from Mao et al., 2010) with the imposed constraint of the nuclear species tree (HCX(Cu,Ju)) topology from this study using BEAST. Blue bars represent 95 % HPD (highest posterior density) for each node, and white trianges with a black outline represent compressed clades. Letters in black circles represent fossil calibration points (corresponding to those in Table 1 in Mao et al., 2010), and numbers in black squares indicate numbers for nodes of interest (see Table 3). ‘HCX’ stands for the Hesperocyparis–Callitropsis–Xanthocyparis clade.

