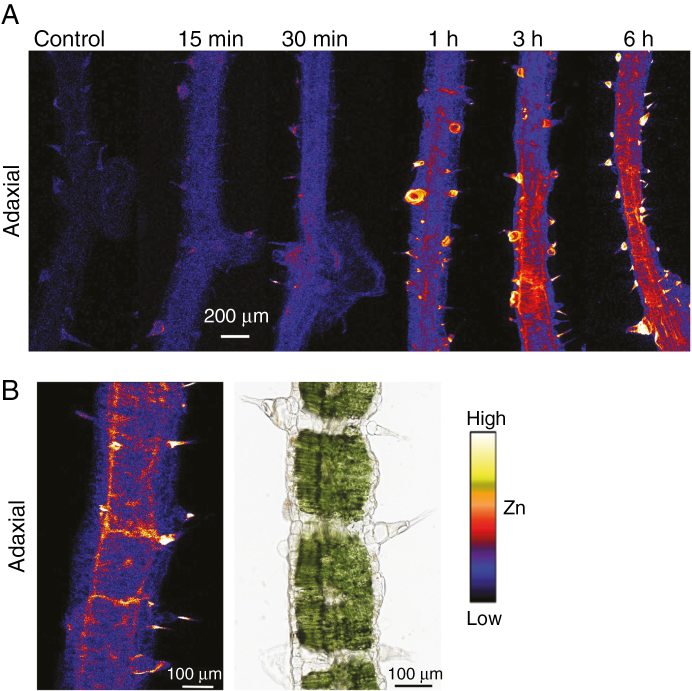
Fig. 5.
(A) µ-XRF scans showing Zn distribution in cross-sections of sunflower leaves (150 µm, freeze dried) underlying ZnSO4 droplets that had been applied for 0 min (control), 15 min, 30 min, 1 h, 3 h, or 6 h. (B) A close-up of a portion of a cross-section (3 h exposure) showing the movement of Zn through the bundle sheath extensions from the adaxial (Zn applied side) to the inner leaf tissues and abaxial side. Note that the µ-XRF image and light micrograph in B are not from the same sample. Rather, the light micrograph is simply provided for reference. Brighter colours correspond to higher Zn concentrations, but colours are not comparable between these Zn maps as their Zn concentrations differed too much to show using the same colour threshold.

