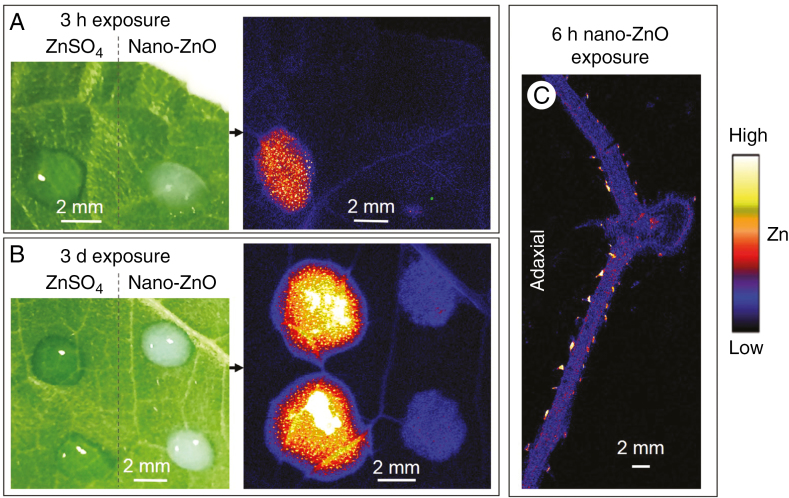
Fig. 6.
Comparison the foliar absorption of nano-ZnO and ZnSO4 in leaves of sunflower after exposure for either 3 h (A) or 3 d (B). In A and B, images on the left are light micrographs showing the Zn droplets on leaves (before being removed), while the images on the right are µ-XRF survey scans showing the distribution of Zn. (C) A µ-XRF scan showing the distribution of Zn in a cross-section of a sunflower leaf (150 µm thick, freeze dried) underlying the Zn droplets after 6 h exposure of nano-ZnO. Brighter colours correspond to higher Zn concentrations, but colours are not comparable between these Zn maps as their Zn concentrations differed too much to show using the same colour threshold.

