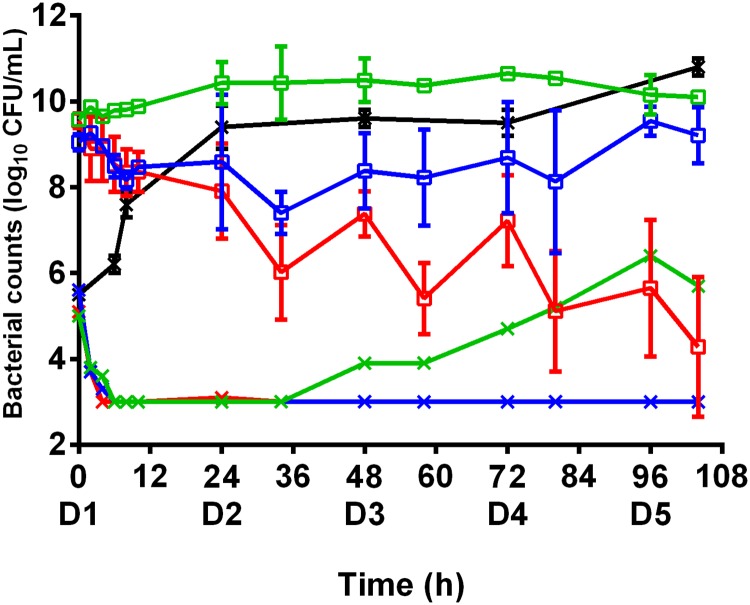
Fig 2. Time-kill curves of the MSSA strain subjected to dynamic concentrations of antibiotic.
Evolution of the bacterial population (log10 CFU/mL) after exposure to amikacin or vancomycin alone or the combination of both over 5 days in RPMI. The marks represent the mean ±SD of the bacterial counts for the different tested treatments (black: control without antibiotic, green: vancomycin twice a day, blue: amikacin once a day, red: amikacin once a day and vancomycin twice a day. Curves with open squares represent the bacterial counts on a large initial inoculum and curves with crosses represent the bacterial counts on a standard initial inoculum. (n = 2 for each treatment on the large inocula and n = 1 for each treatment on the standard inocula) and LOD = 2.5 log10 CFU/mL). The bacterial counts from 0 to 24 h after exposure to vancomycin were significantly higher (p<0.01) than those obtained with amikacin or the combination. The bacterial counts from 0 to 104 h were significantly different for each treatment (p<0.01).

