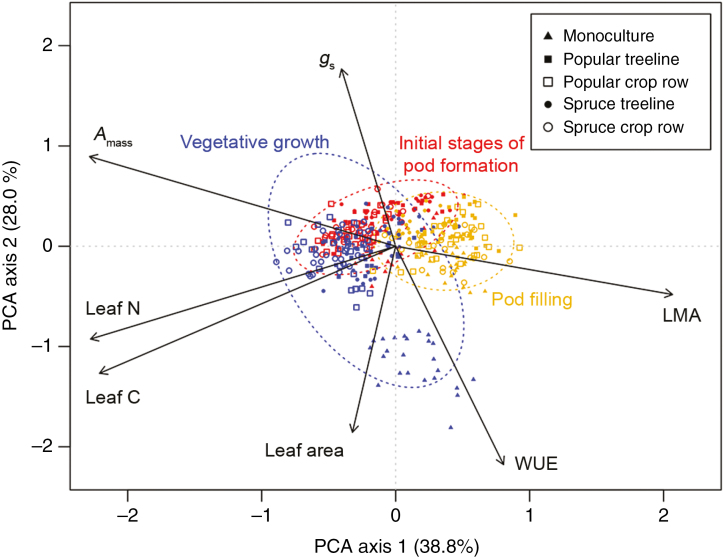
Fig. 2.
Principal components analysis (PCA) representing multivariate relationships among seven leaf functional traits in Glycine max. Sample size for PCA was n = 399 leaves; different symbols correspond to the five different management conditions, and three colours correspond to three different leaf trait sampling periods. Coloured dashed lines correspond to 95 % confidence ellipses surrounding leaves measured within the same plant developmental stage. Plant developmental stage explained the largest proportion of variation (55.1 %) in PCA axis 1 scores, while management conditions explained the largest proportion of variation (55.7 %) of the variation in PCA axis 2 scores (see Fig. 3; Supplementary Data Table S1).

