Figure 5.

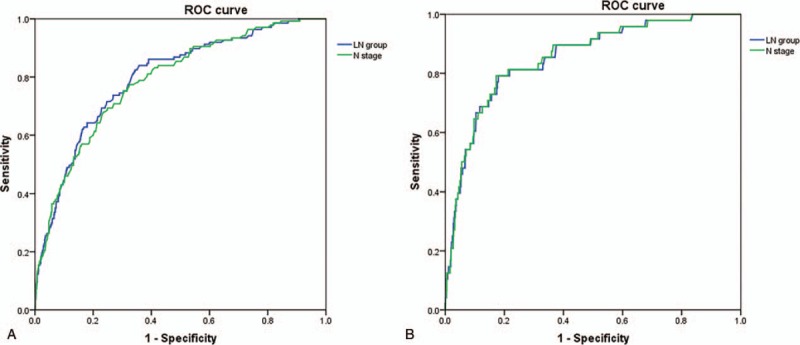
Predictive values of LN group and N stage systems. Both LN group and N stage had the same predictive power for OS (A) and DSS (B). DSS = disease-specific survival, LN = lymph node, OS = overall survival.

Predictive values of LN group and N stage systems. Both LN group and N stage had the same predictive power for OS (A) and DSS (B). DSS = disease-specific survival, LN = lymph node, OS = overall survival.