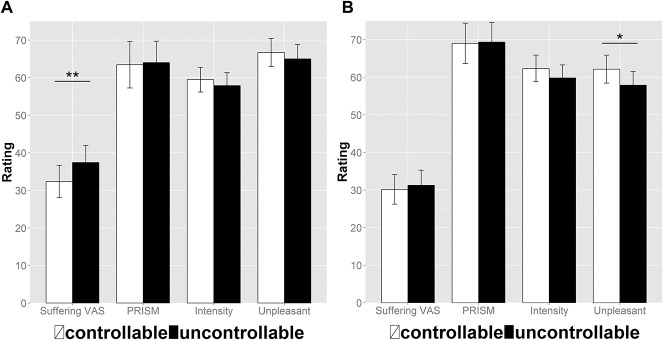
Figure 2.
Effect of controllability on ratings in the original sample (A) and the second experiment (B): Bars show mean percentages of the pain intensity, pain unpleasantness, suffering VAS, and PRISM ratings for the controllable condition (white) and the uncontrollable (black) condition, and error bars depict the standard error of the mean. Asterisks show significant repeated-measures t tests (controllable vs uncontrollable) with *P < 0.05 and **P < 0.01. VAS, visual analogue scale.

