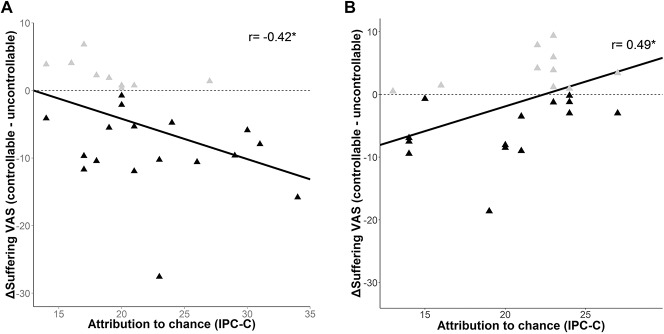
Figure 3.
Impact of attributional style on the effects of control in the original sample (A) and the second experiment (B): the x-axis shows the chance subscale of the IPC. The y axis shows the difference (Δ) in the suffering VAS ratings, depicted as percentage values. Ratings in the uncontrollable condition were subtracted from ratings in the controllable condition. The black triangles depict the participants who indicated more suffering when pain could not be controlled. The gray triangles depict participants who indicated more suffering when pain could be controlled. IPC-C, chance subscale of the internal, powerful others, and chance scale; VAS, visual analogue scale. * P < 0.05.

