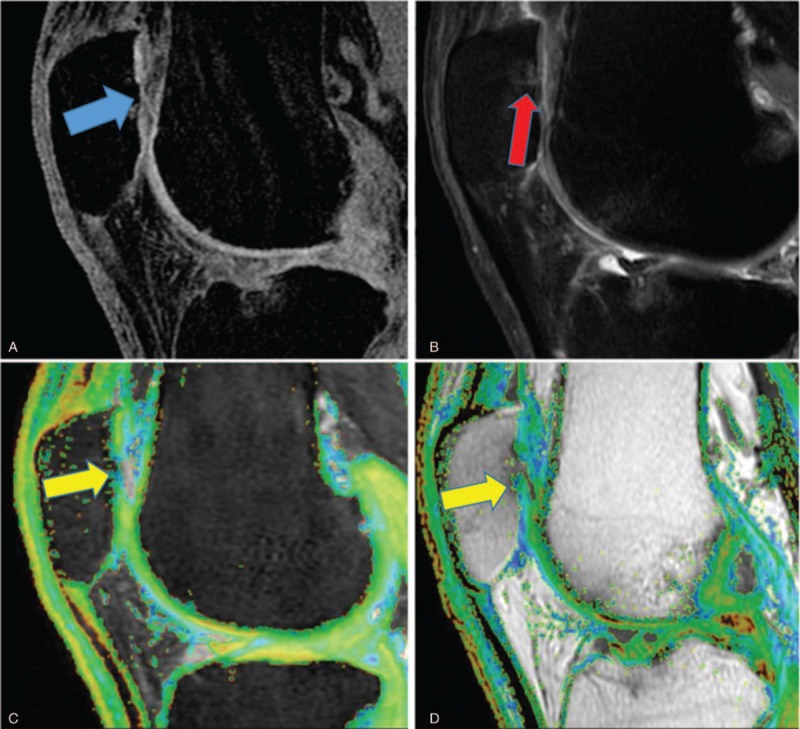
Figure 3.

3D SPGR image (A), PD (B), T1ρ color map (C), and T2 color map (D) of a representative OA patient. The central region of the patella cartilage was thin and worn (blue arrow) (A), and there was bone edema (red arrow) under the cartilage lesion (B). T1ρ and T2 relaxation times of the middle region (yellow arrow) (77.77 ms and 78.86 ms, respectively) were higher than the surrounding region. 3D SPGR = 3D fat-suppressed spoiled gradient, OA = osteoarthritis.
