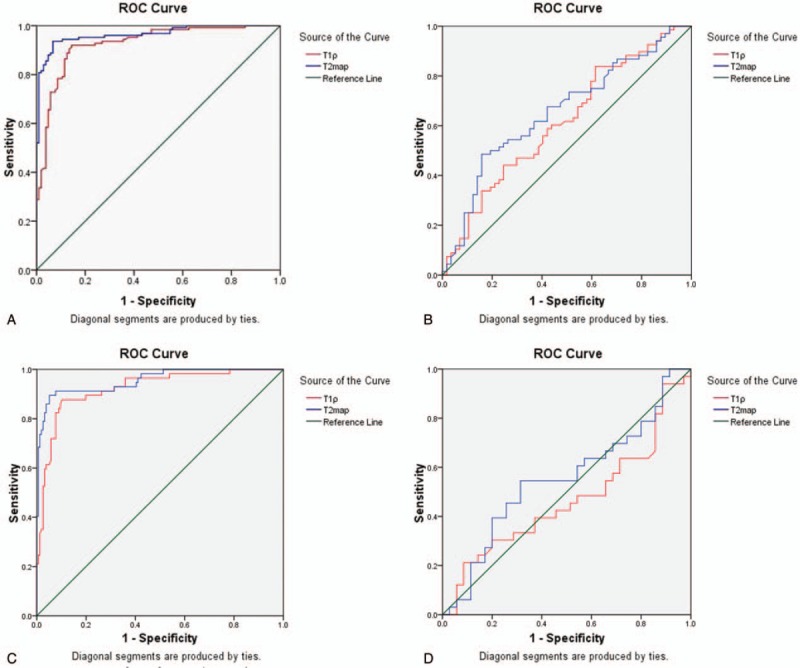
Figure 4.

(A) ROC curve analysis of T1ρ and T2 mapping sequence in identifying normal and OA cartilage. (B) ROC curve analysis of T1ρ and T2 mapping sequence in identifying normal and Noyes IIA cartilage. (C) ROC curve analysis of T1ρ and T2 mapping sequence in differentiating Noyes IIA from IIB and Noyes III (IIIA and IIIB) cartilage. (D) ROC curve analysis of T1ρ and T2 mapping sequence in identifying Noyes IIB and Noyes III (IIIA and IIIB) cartilage. ROC = receiver operating characteristic.
