
Figure 2.
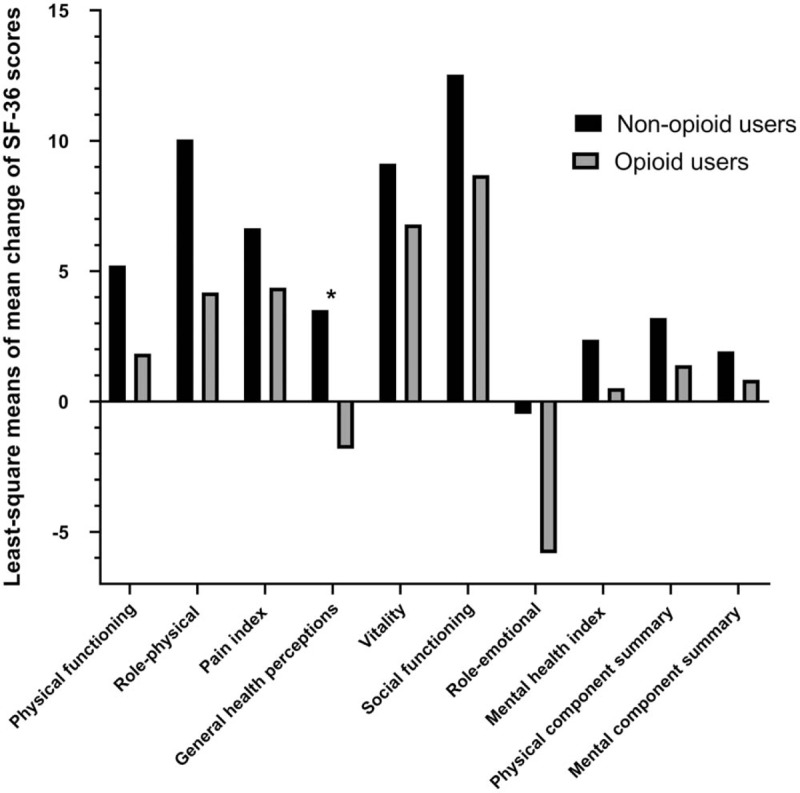
Comparison of least-square means of mean change of SF-36 (Short Form-36 Health Status Questionnaire) subscale and summary scores between opioid users and nonopioid users. ∗P < .05.
Official websites use .gov
A
.gov website belongs to an official
government organization in the United States.
Secure .gov websites use HTTPS
A lock (
) or https:// means you've safely
connected to the .gov website. Share sensitive
information only on official, secure websites.
Comparison of least-square means of mean change of SF-36 (Short Form-36 Health Status Questionnaire) subscale and summary scores between opioid users and nonopioid users. ∗P < .05.