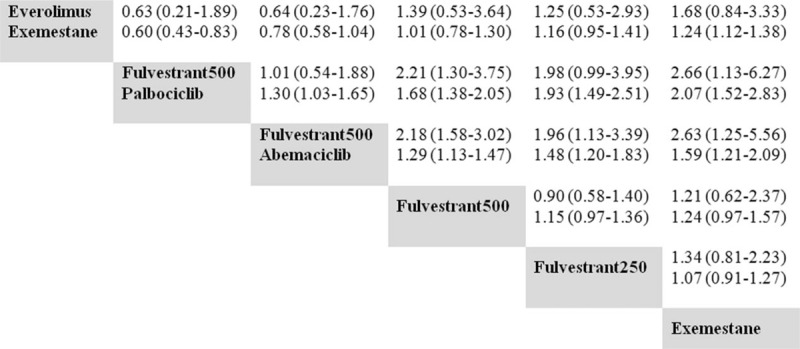
Figure 4.

Pooled ORs for response. Treatments in the columns are compared with those in the rows. The first line shows the ORs for overall response rate, and the second line shows the ORs for clinical benefit rates. ORs = odds ratios.

Pooled ORs for response. Treatments in the columns are compared with those in the rows. The first line shows the ORs for overall response rate, and the second line shows the ORs for clinical benefit rates. ORs = odds ratios.