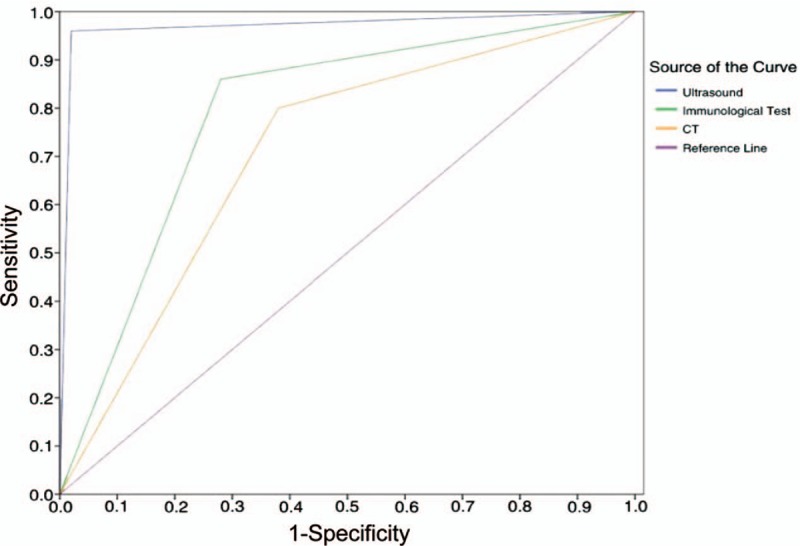
Figure 2.

ROC analysis. ROC was used to compare the diagnostic value of the ultrasound, CT and serological testing. The area under ROC curve of ultrasound, CT and serological testing was 0.97, 0.79, and 0.71, respectively. CT = computed tomography, ROC = receiver operating characteristic.
