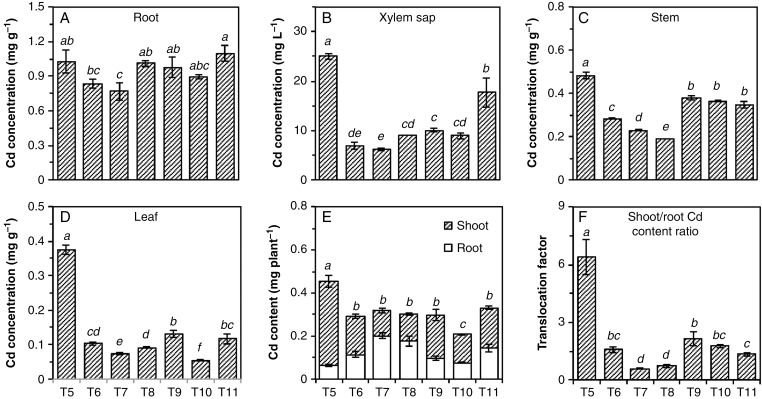
Fig. 1.
Concentrations of Cd in roots (A), xylem sap (B), stems (C) and leaves (D), total Cd content (E) and Cd translocation factor (F) of Carpobrotus rossii grown in different treatments for 10 d. T5, 15 μm Cd; T6, 15 μm Cd + 25 mm NaNO3; T7, 15 μm Cd + 12.5 mm Na2SO4; T8, 15 μm Cd + 25 mm NaCl; T9, 22 μm Cd + 25 mm NaNO3; T10, 42 μm Cd + 12.5 mm Na2SO4; T11, 50 μm Cd + 25 mm NaCl. Error bars represent ± s.e.m. of three replicates. Means with a common letter did not differ significantly (Duncan’s test, P < 0.05) (Experiment 1).

