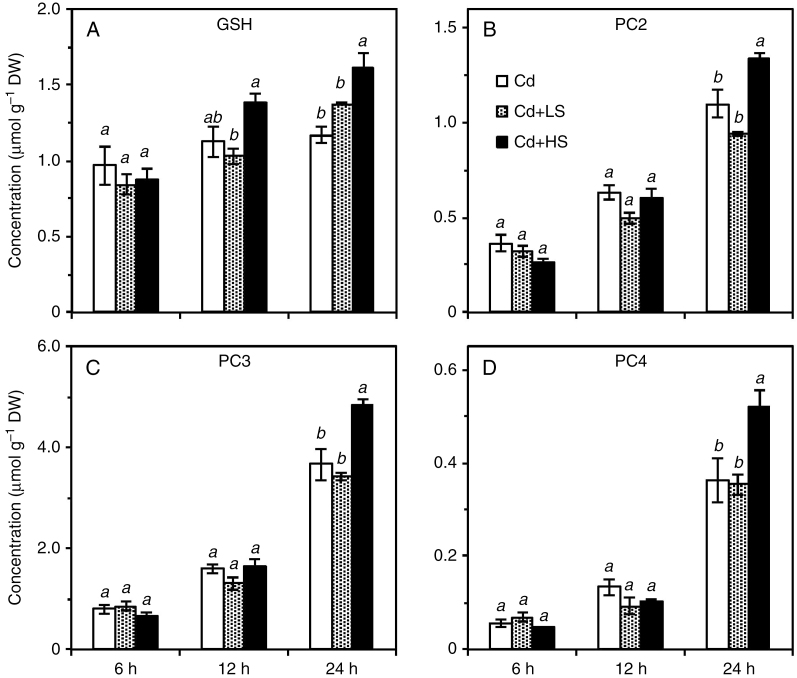
Fig. 6.
Concentrations of GSH (A), PC2 (B), PC3 (C) and PC4 (D) in roots of Carpobrotus rossii grown in solutions with the same Cd2+ activity (10.9 µm) for 6, 12 and 24 h. Cd, 15 μm Cd; Cd + LS (low salt), 50 μm Cd + 25 mm NaCl; Cd + HS (high salt), 85 μm Cd + 50 mm NaCl. Error bars represent ± s.e.m. of three replicates. Means with the same letter did not differ significantly at each harvest time (Duncan’s test, P < 0.05) (Experiment 2). DW, dry weight.

