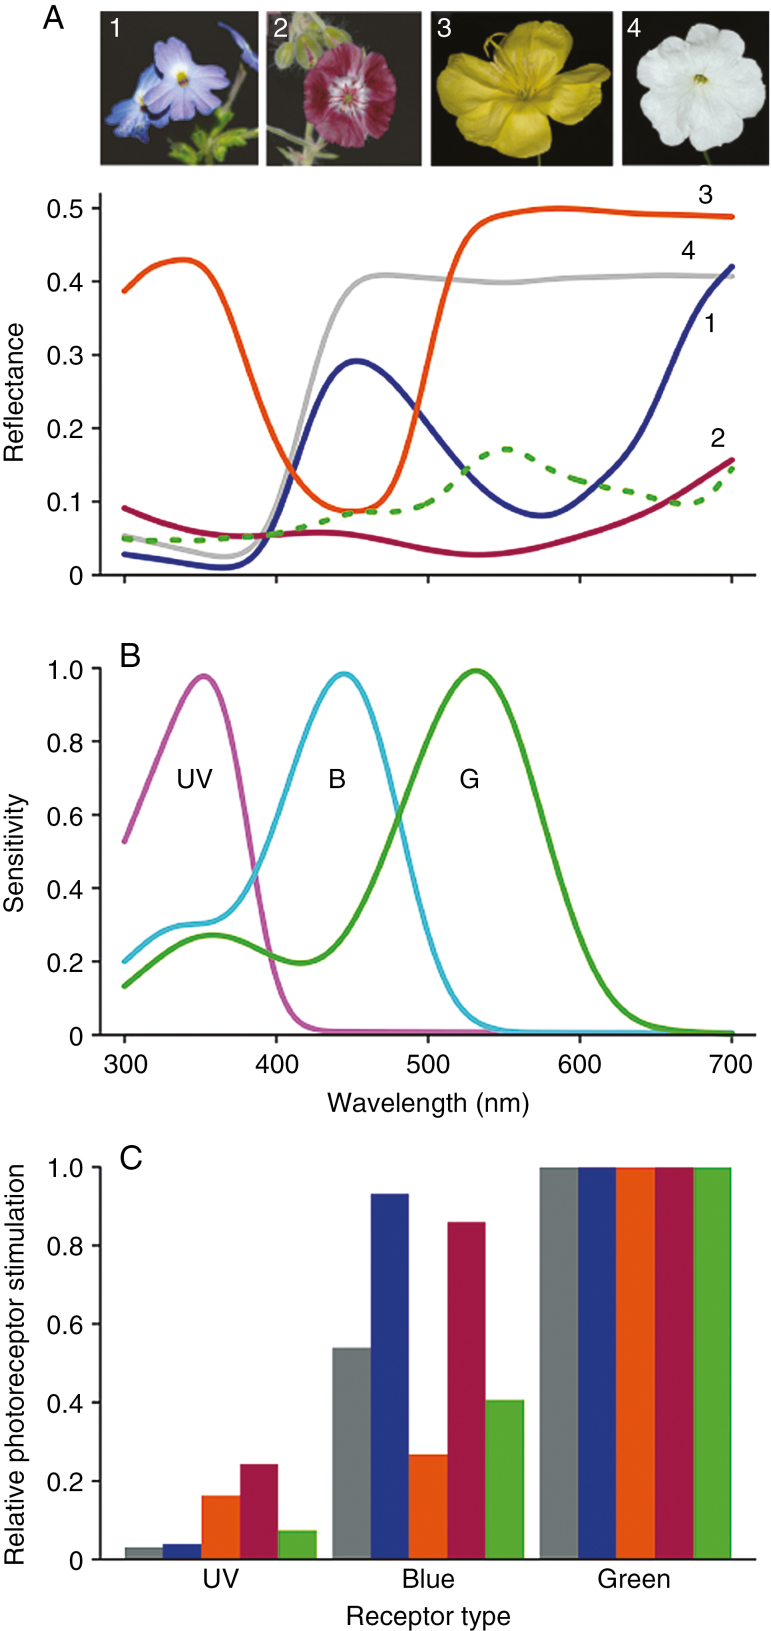
Fig. 2.
Reflectance spectra and their visual signals for four example flowers. (A) Reflectance spectra of four differently coloured flowers and an average green background spectrum: 1, Browallia americana; 2, Geranium phaeum; 3, Oenothera glazioviana; 4, Petunia nyctaginiflora; dashed curve, average green background. (B) Honey bee photoreceptor spectral sensitivities (after Peitsch et al., 1992). Relative photon stimulation for the different reflectance spectra of panel A for the different photoreceptors, using the photoreceptor spectral sensitivity shown in panel B. See Supplementary Data Table S1 for specific aspects of the spectra and interpretation with vision models.

