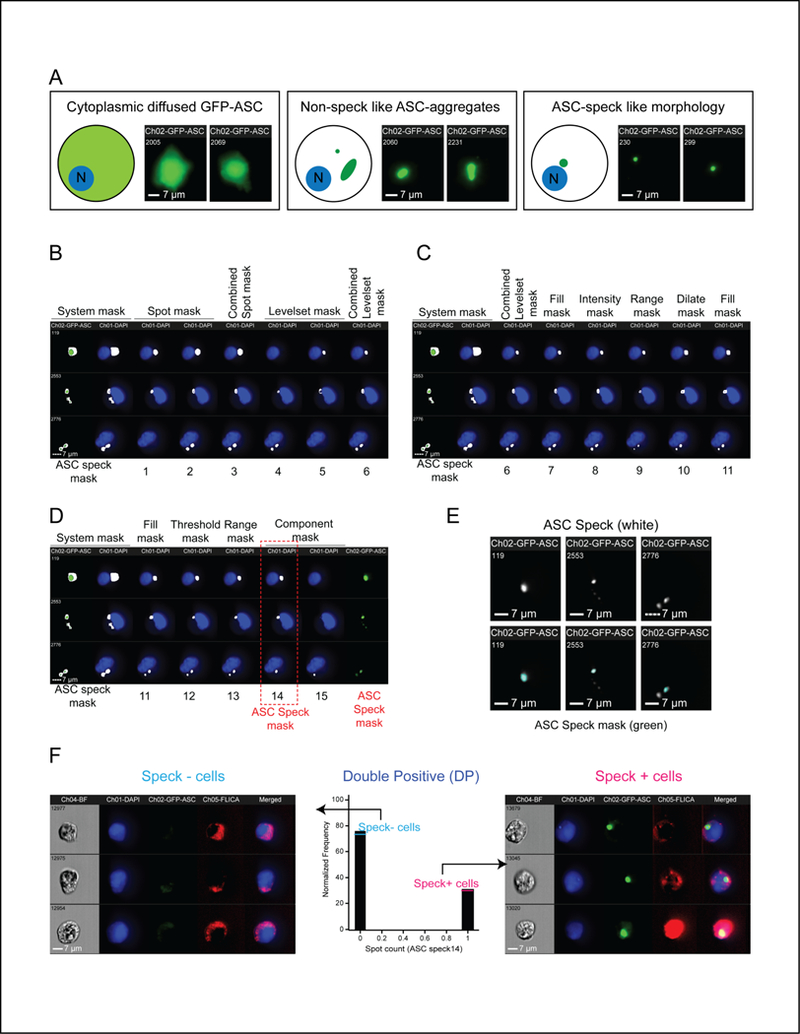
Figure 2: ASC speck masking strategy and calculation for frequency of cells with specks.

A. Schematic and representative images of sample HEK293T cell populations used to generate ASC speck mask. B-D. ASC Speck masking strategy. DAPI (blue), GFP-ASC (green) and corresponding ASC speck mask (white) are shown. “ASC speck mask” columns indicate the default system mask on the GFP channel alone (left) or with this mask superimposed on the DAPI channel (right). Numbers 1–15 represent different ASC masks (described in Table-II) sequentially applied to modify the default mask. B. Identifying bright, punctate staining. Spot masks: Recognize single punctate staining (ASC Mask 1). Identify multiple puncta (ASC Mask 2). Combined Spot mask 1 and 2 (ASC Mask 3). Levelset masks based on GFP signal threshold: Detect dimmer signals (ASC Mask 4). Detect brighter signals (ASC Mask 5). Combined Levelset masks 4 and 5 (ASC Mask 6). C. Differentiating GFP aggregates from ASC specks. A Fill mask was applied to make ASC mask 6 uniform (ASC Mask 7) with an Intensity mask to select pixels above a selected intensity (ASC Mask 8). A Range mask was applied to define minimum diameter and near circularity criteria (ASC Mask 9) and a Dilate mask was used to refine the size of ASC Mask 9 (ASC Mask 10) with another Fill mask for uniformity (ASC Mask 11). D. Final refinements to differentiate ASC specks from artifacts. A Threshold mask was used to eliminate GFP aggregates (ASC Mask 12) and was improved with a Range mask for area and circularity (ASC Mask 13). Some non-speck like aggregates were further sorted in terms of area (Component mask). The mask with the highest area (ASC Mask 14; highlighted by red box) is referred to as “ASC speck mask” as described in the study. E. ASC speck mask accurately reflects speck morphology. Micrograph of ASC specks (top). ASC specks with superimposed ASC speck mask (green; bottom). F. Determining ASC speck frequency. Histogram of cells evaluated with the “Spot count” function on the ASC speck mask (center; Spot count of 0 = speck negative (–), 1 = speck positive (+)). Representative images from speck- (left) and speck+ (right) sub-populations
