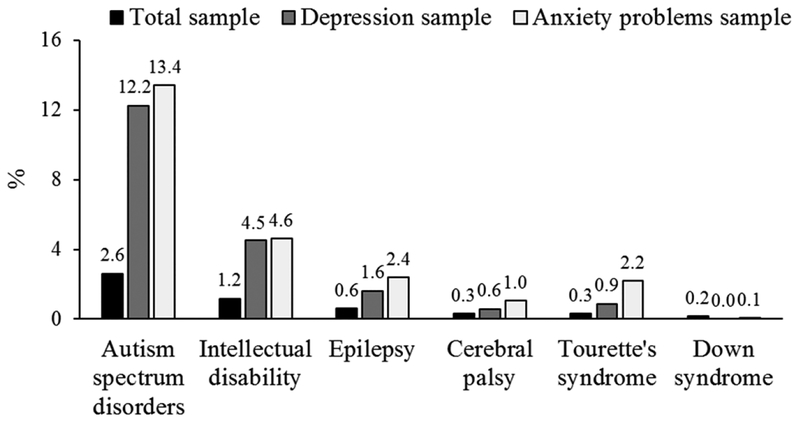
Figure 2.
Total, depression, and anxiety problems sample prevalence in children and adolescents by specific neurological disorders. Bar graphs represent the prevalence of specific neurological disorders among the total sample (weighted estimate: 49,642,709) and among the sample of children and adolescents with depression (weighted estimate: 1,925,131) or anxiety problems (weighted estimate: 4,201,418). Prevalence among specific neurological disorders were calculated for each disorder compared to those without the disorder.

