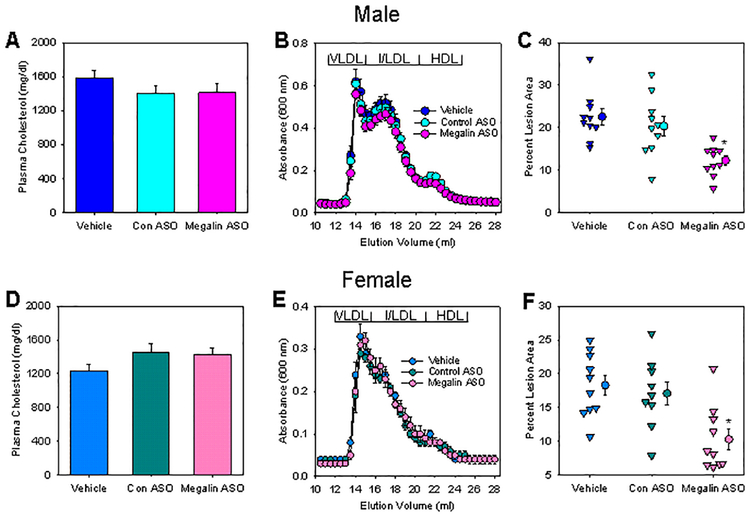
Figure 2. Inhibition of megalin reduced hypercholesterolemia-induced atherosclerosis.
(A and D) Plasma total cholesterol concentrations in mice were measured using an enzymatic colorimetric method in mice fed Western diet for 12 weeks. N = 9 – 10/group. (B and E) Lipoprotein distributions of cholesterol in plasma were determined using FPLC size exclusion chromatography. N = 4/group. (C and F) Percent atherosclerotic lesion area was measured using an en face technique. N = 9 – 10/group. * P < 0.001 (C) or P = 0.002 (F) by one way ANOVA followed by Holm-Sidak method.

