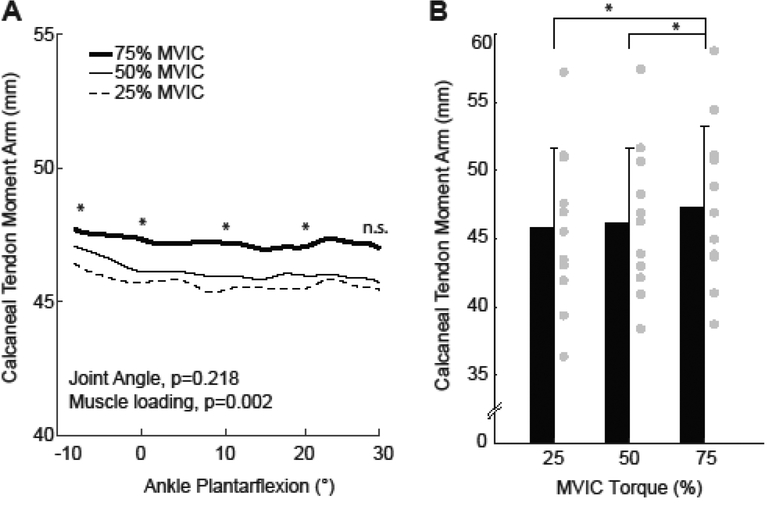
Figure 3.
(A) Group mean calcaneal (i.e., Achilles) tendon moment arms from isotonic contractions performed at three levels of ankle moment generation across the range of motion tested. (B) Group mean (standard deviation) calcaneal tendon moment arm from (A) averaged across the range of motion, thereby illustrating the main effect of muscle loading. Repeated measures ANOVA main effects of joint and angle and muscle loading shown, with significant pairwise comparisons designated by asterisks (*). p<0.05 significant. n.s.: not significant. Gray circles indicate individual subject data for each condition.

