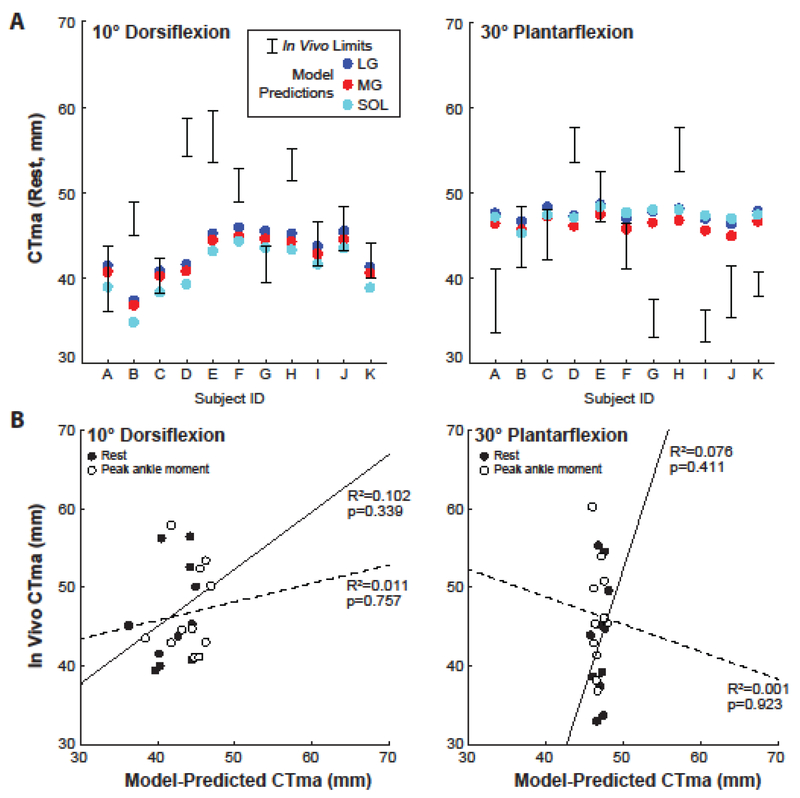
Figure 4.
(A) Individual subject comparisons between in vivo estimates and model predictions for each of the muscles that share the calcaneal tendon (LG: lateral gastrocnemius, MG: medial gastrocnemius, SOL: soleus) at angles representing the range of motion tested. In vivo estimates show the range of physiologically plausible values for each subject as defined by the superficial and deep edges of the calcaneal tendon. (B) Correlations between in vivo estimates and model predictions at 10° dorsiflexion and 30° plantarflexion for values extracted at rest (solid line) and at peak ankle moment (dashed line) from isometric testing. Model predicted values here represent the average moment arm of the three muscles that shared the calcaneal tendon.

