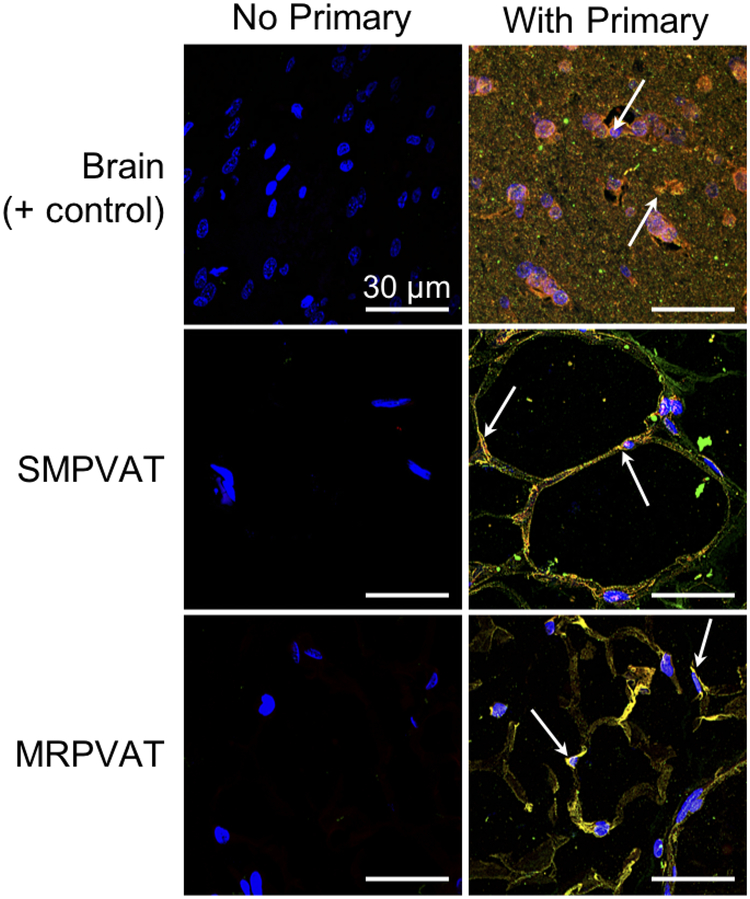
Figure 4.
VMAT2 and NE co-localize in superior mesenteric (SM, middle) and mesenteric (MR, bottom) PVATs. Immunofluorescence Z-stack images with primary antibodies against VMAT2 (red) and NE (green) on the right and negative control image for each tissue on the left. Images were taken with a 120× oil objective on a confocal microscope. Arrows indicate areas of positive staining. All scale bars represent 30 μm. Representative of 4 animals. Positive control tissue (top) was the caudate putamen region of the rat brain.

