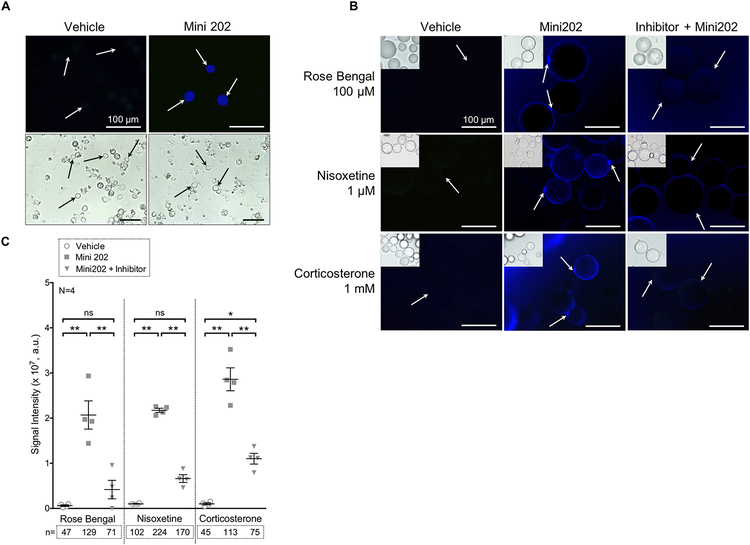
Figure 5.
Mini 202 uptake in mesenteric PVAT adipocytes is VMAT-, NET-, and OCT3-dependent.
(A) Images of the Mini 202 positive control: rat adrenal medulla chromaffin cells. Vehicle on left and Mini 202 condition on right. Fluorescent images (top row) with corresponding brightfield images (bottom row). Images were taken with a 40× objective. Arrows indicate healthy (non-granulous) chromaffin cells that have taken up Mini 202. All scale bars represent 100 μm. (B) Fluorescent images of vehicle (left), Mini 202 (middle), and Inhibitor + Mini 202 (right) for the three inhibitors: Rose Bengal (top), nisoxetine (middle), and corticosterone (bottom). Images were taken with a 40× objective. Arrows indicate areas of interest. All scale bars represent 100 μm. Brightfield image inset for reference. (C)
Quantification of Mini 202 fluorescence when taken up by MRPVAT adipocytes. Fluorescence was decreased by treatment with VMAT inhibitor (Rose Bengal), and inhibitors of plasma membrane transporters NET (nisoxetine) and OCT3 (corticosterone). n values below graph indicate the number of cells quantified in duplicate (i.e. the average number of cells quantified by each researcher). a.u. indicates arbitrary units of signal intensity. Bars represent mean ± SEM for four biological replicates (N=4). * p=0.0013, and ** p<0.0001 by a one-way ANOVA.

