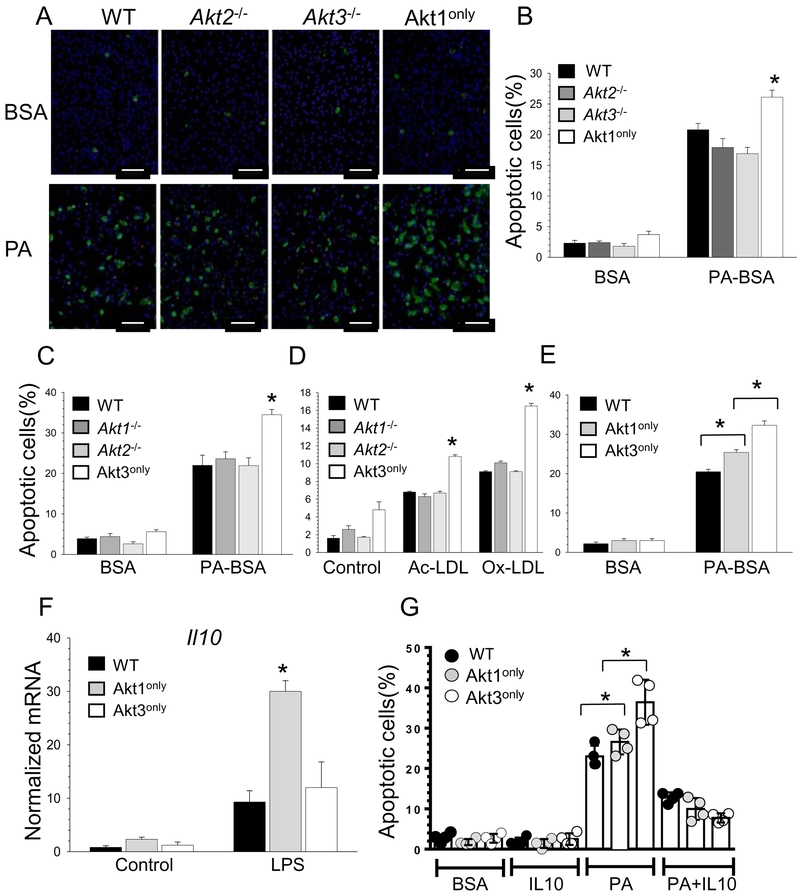
Figure 6. Akt1only and Akt3only macrophages are more sensitive to pro-apoptotic cells stimuli than WT and a single Akt isoform knockout cells, and Il-10 suppresses apoptosis in macrophages.
(A,B) WT, Akt2−/−, Akt3−/− or Akt1only peritoneal macrophages were isolated from recipient mice (n=4/group) and two days later treated with BSA or 0.5mM PA-BSA overnight. Apoptotic cell numbers were detected by Alexa Flour 488 Annexin V/Dead cell apoptosis kit. Graphs represent data (mean ± SEM; *p<0.05 compared to WT cells treated with PA-BSA by One Way Analysis of Variance); Scale bar is 50mm.
(C-D) The percent of apoptosis in WT, Akt1−/−, Akt2−/− or Akt3only macrophages after treatment with BSA or PA-BSA overnight, or incubated with human Ac-LDL (100mg/ml) plus an ACAT inhibitor Sandoz 58035 (2mg/ml) or with Ox-LDL (100mg/ml) for 48 hours. Graphs represent data (mean ± SEM) obtained from the same number (n=3/group) of mice, *p<0.05 compared to WT cells treated with PA-BSA, Ac-LDL or Ox-LDL by One Way Analysis of Variance.
(E) Akt1only macrophages are more resistant to apoptosis than Akt3only cells
(F) WT, Akt1only and Akt3only macrophages were treated with LPS (20ng/ml) for 6 hours and gene expression levels were measured by real-time PCR. Graphs represent data (mean ± SEM) obtained from the same number (n=3/group) of mice (*p<0.05 compared to WT cells treated with LPS by One Way Analysis of Variance).
(G) Macrophages were isolated from mice reconstituted with WT, Akt1only and Akt3only FLC and, after two days in culture, were treated with BSA or a mouse recombinant Il-10 (100ng/ml) or 0.5M PA-BSA with or without of IL-10 for 24 hours. Apoptotic cells were detected by Alexa Flour 488 Annexin V. Graphs represent data (mean ± SD) obtained from the same number (n=4/group) of mice (*p<0.05 compared to WT cells treated with PA-BSA by One Way Analysis of Variance).

