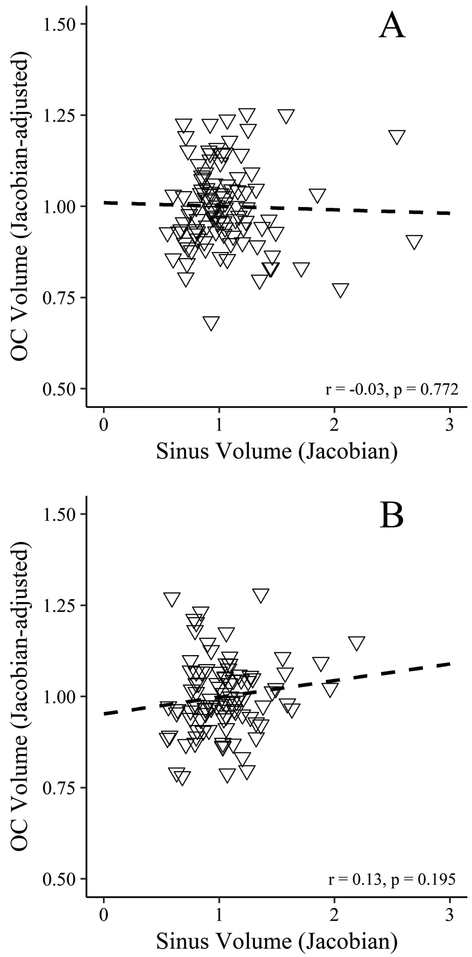
Figure 3.
Scatterplots for the (A) MUSC and (B) Hammersmith samples with associations between olfactory cleft volumes (expressed as the mean Jacobian determinants after adjusting for the effects of sex and the head size estimate) and sinus volumes. The individual olfactory cleft volumes were scaled to demonstrate their relationship to the overall sample mean (centered at 1).

