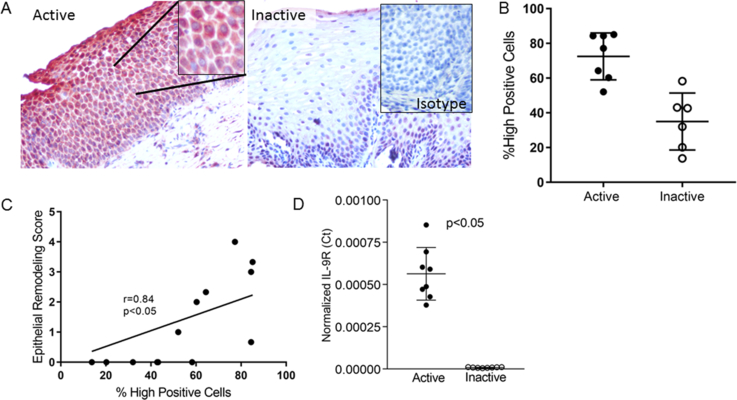
Figure 1. IL-9 receptor (IL-9R) expression in EoE.
Representative images (A) and quantitation (B) of IL-9R positive cells in the esophageal epithelium of active and inactive EoE biopsies. Inset in inactive biopsy shows isotype control on an active EoE biopsy. Lines represent mean and standard deviation. The correlation between IL-9R expression and epithelial remodeling (C). Normalized IL-9R mRNA expression in active and inactive biopsies. Bars represent the mean and standard deviation (D).

