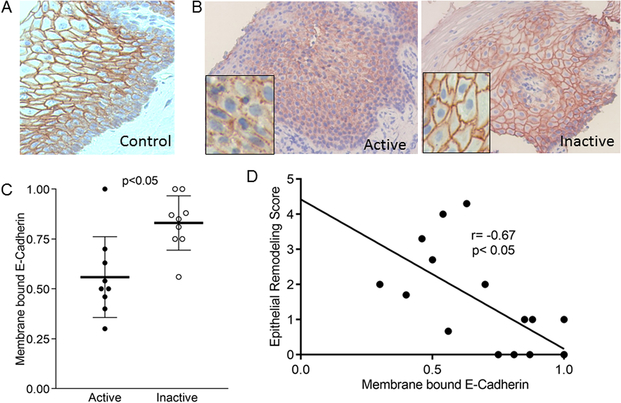
Figure 2. E-cadherin expression in EoE.
Representative images of E-cadherin in control (A), inactive, and active EoE (B). Quantitation of membrane bound E-cadherin in active and inactive EoE. Lines represent means, bars are standard deviation (C). Correlation between the severity of esophageal epithelial remodeling and membrane bound E-cadherin (D)

