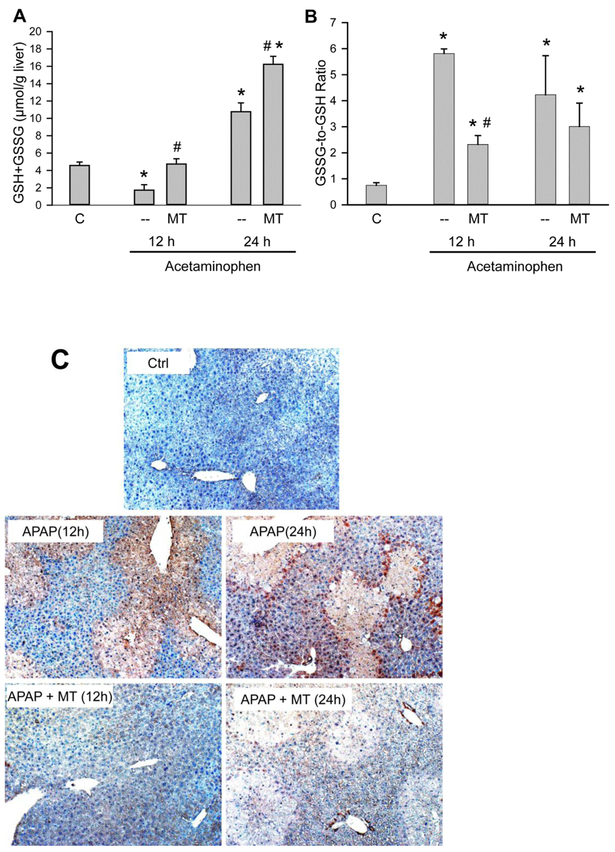
Figure 2: MT attenuated APAP-induced mitochondrial oxidant stress.
Mice were treated with 300 mg/kg APAP, and 20 mg/kg MT or saline was given 1.5 h later. (A) Total liver GSH levels. (B) GSSG-to-GSH ratios. (C) Representative nitrotyrosine staining of liver sections (50x). Bars represent mean ± SEM for n = 4 mice per group. *p<0.05 vs. Ctrl. #p<0.05 vs. APAP.

