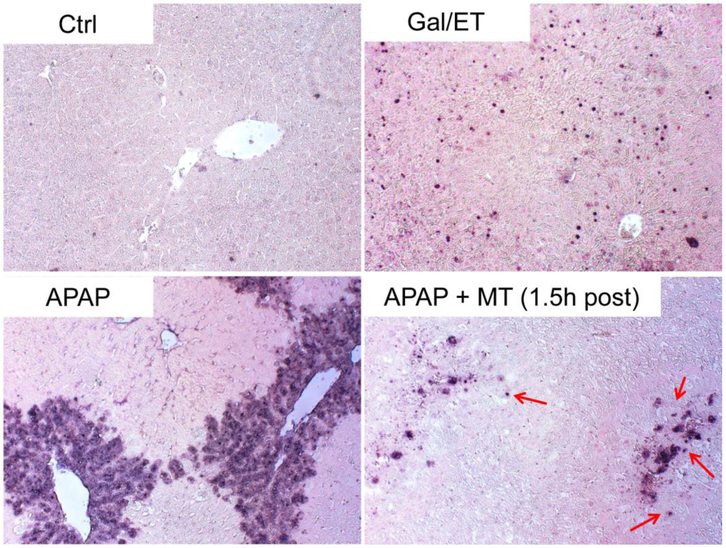
Figure 4: MT treatment resulted in apoptotic morphology in centrilobular hepatocytes at late phase of APAP hepatotoxicity.
Mice were treated with 300 mg/kg APAP, and 20 mg/kg MT or saline was given 1.5 h later. Mice treated with Gal/ET for 6h were used as the positive control for apoptosis. Representative TUNEL staining of liver sections, with arrows denoting hepatocytes showing apoptotic morphology (100x).

