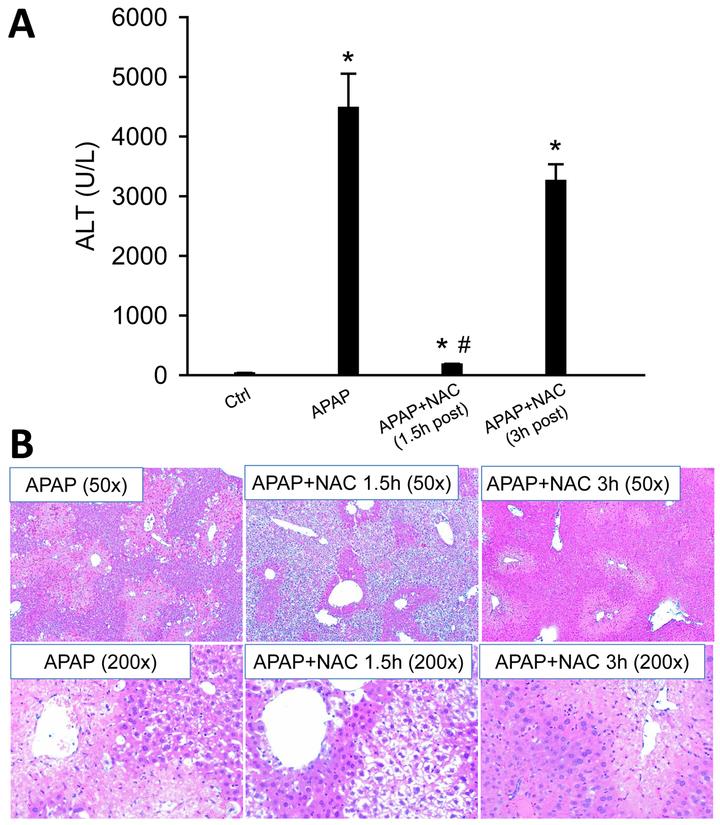
Figure 8: Posttreatment with NAC did not induce apoptotic morphology.
Mice were treated with 300 mg/kg APAP, and 500 mg/kg NAC was given 1.5 h or 3 h later. (A) Plasma levels of ALT. (B) Representative H&E stained liver sections (50x). Bars represent means ± SEM for n = 4 mice per group. *p<0.05 vs. Ctrl. #p<0.05 vs. APAP.

