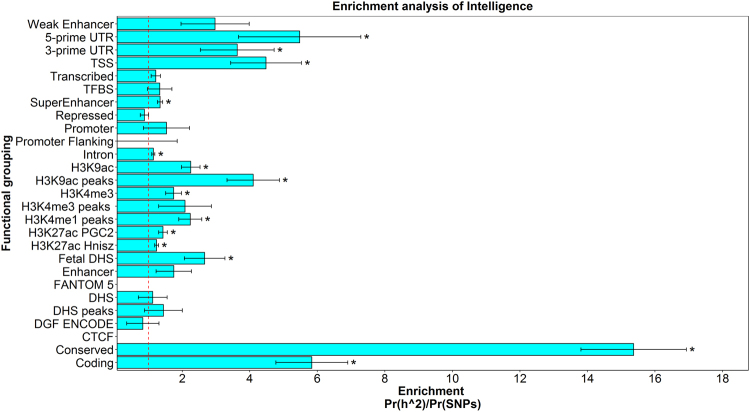
Fig. 3. Enrichment analysis for intelligence using the 52 functional categories.
This analysis differs from that performed by FUMA as all SNPs are used whereas, in FUMA, only those in the independent genomic loci are annotated. The enrichment statistic is the proportion of heritability found in each functional group divided by the proportion of SNPS in each group (Pr(h2)/Pr(SNPs)). The dashed line indicates no enrichment found when Pr(h2)/Pr(SNPs) = 1. Statistical significance is indicated by asterisk

